Hello fellow traders. In this article we’re going to take a quick look at the Elliott Wave charts of FTSE, published in members area of the website. As our members know FTSE is showing bullish sequences in the cycle from the October’s 6708.6 low. Consequently we expected further rally to continue.We recommended members to avoid selling the index, while keep favoring the long side. In the further text we are going to explain the Elliott Wave Forecast.
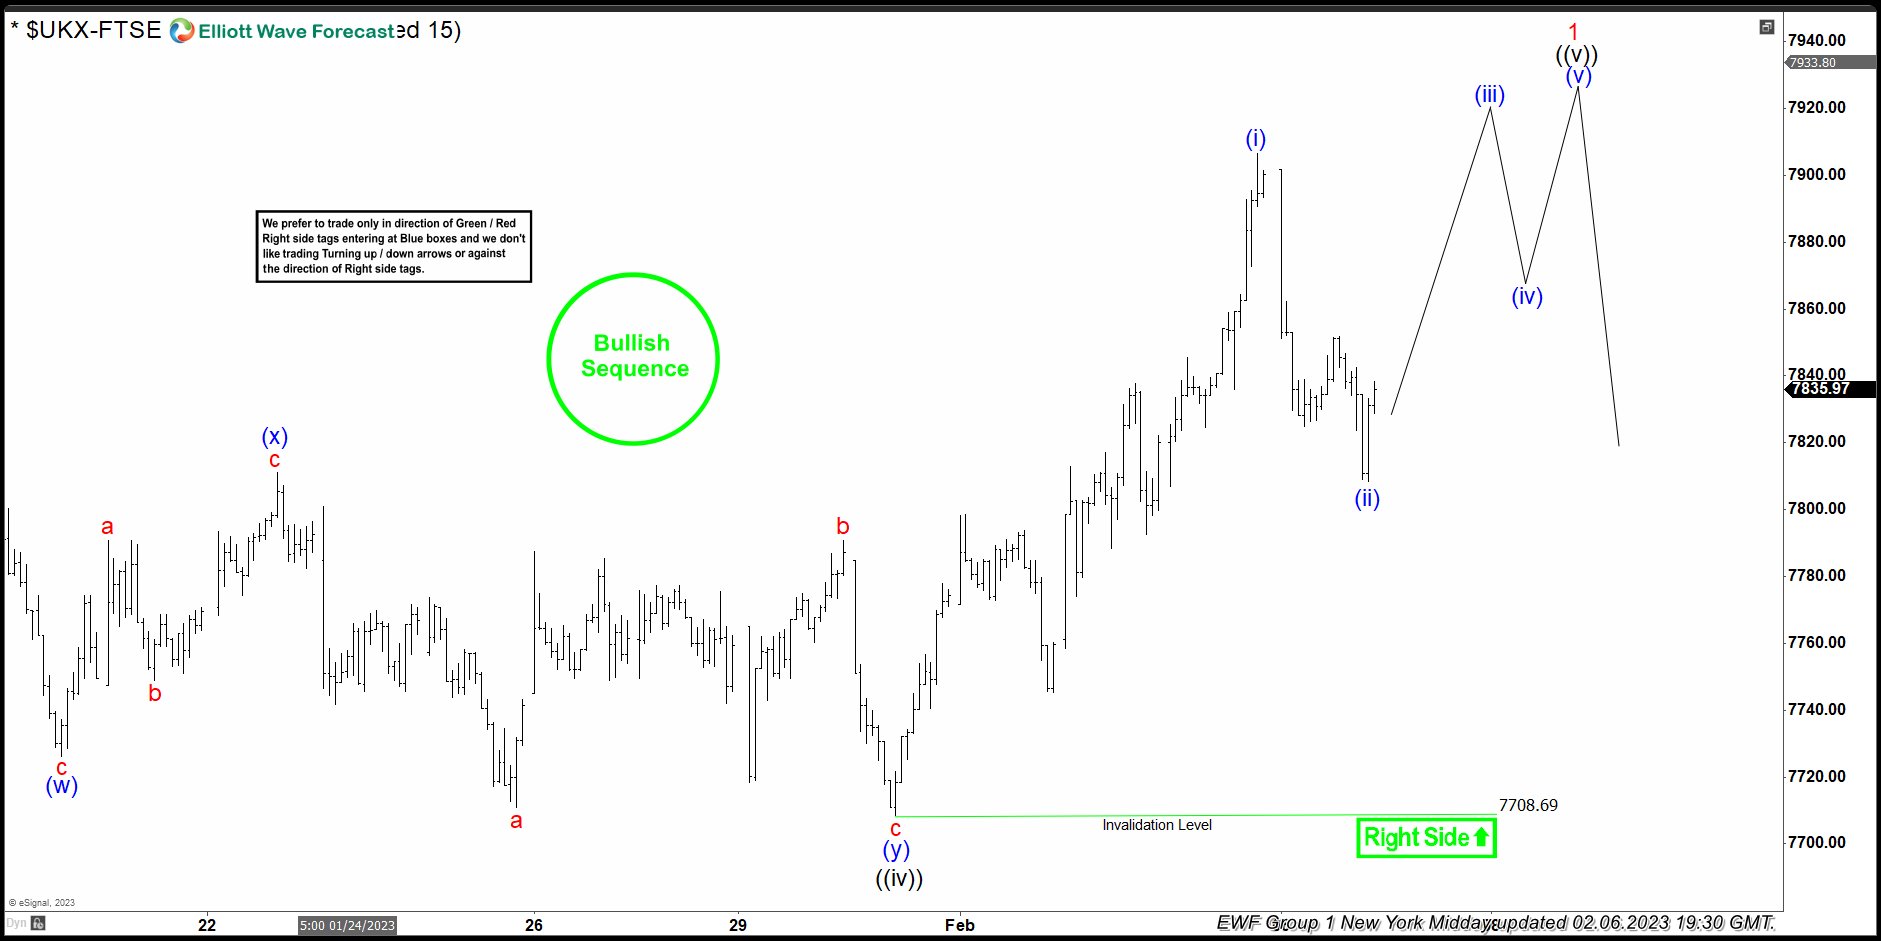
FTSE Elliott Wave 1 Hour Chart 02.06.2022
FTSE remains bullish against the 7708.69 pivot in first degree. We believe wave ((v)) is still in progress, when now we ended (ii) of ((v)). We expect to see Elliott Wave Ending Diagonal potentially, so structure should be 5 waves up from the 7708.69 low. Buyers should ideally appear for the further rally toward new highs.
You can learn more about Elliott Wave Patterns at our Free Elliott Wave Educational Web Page.
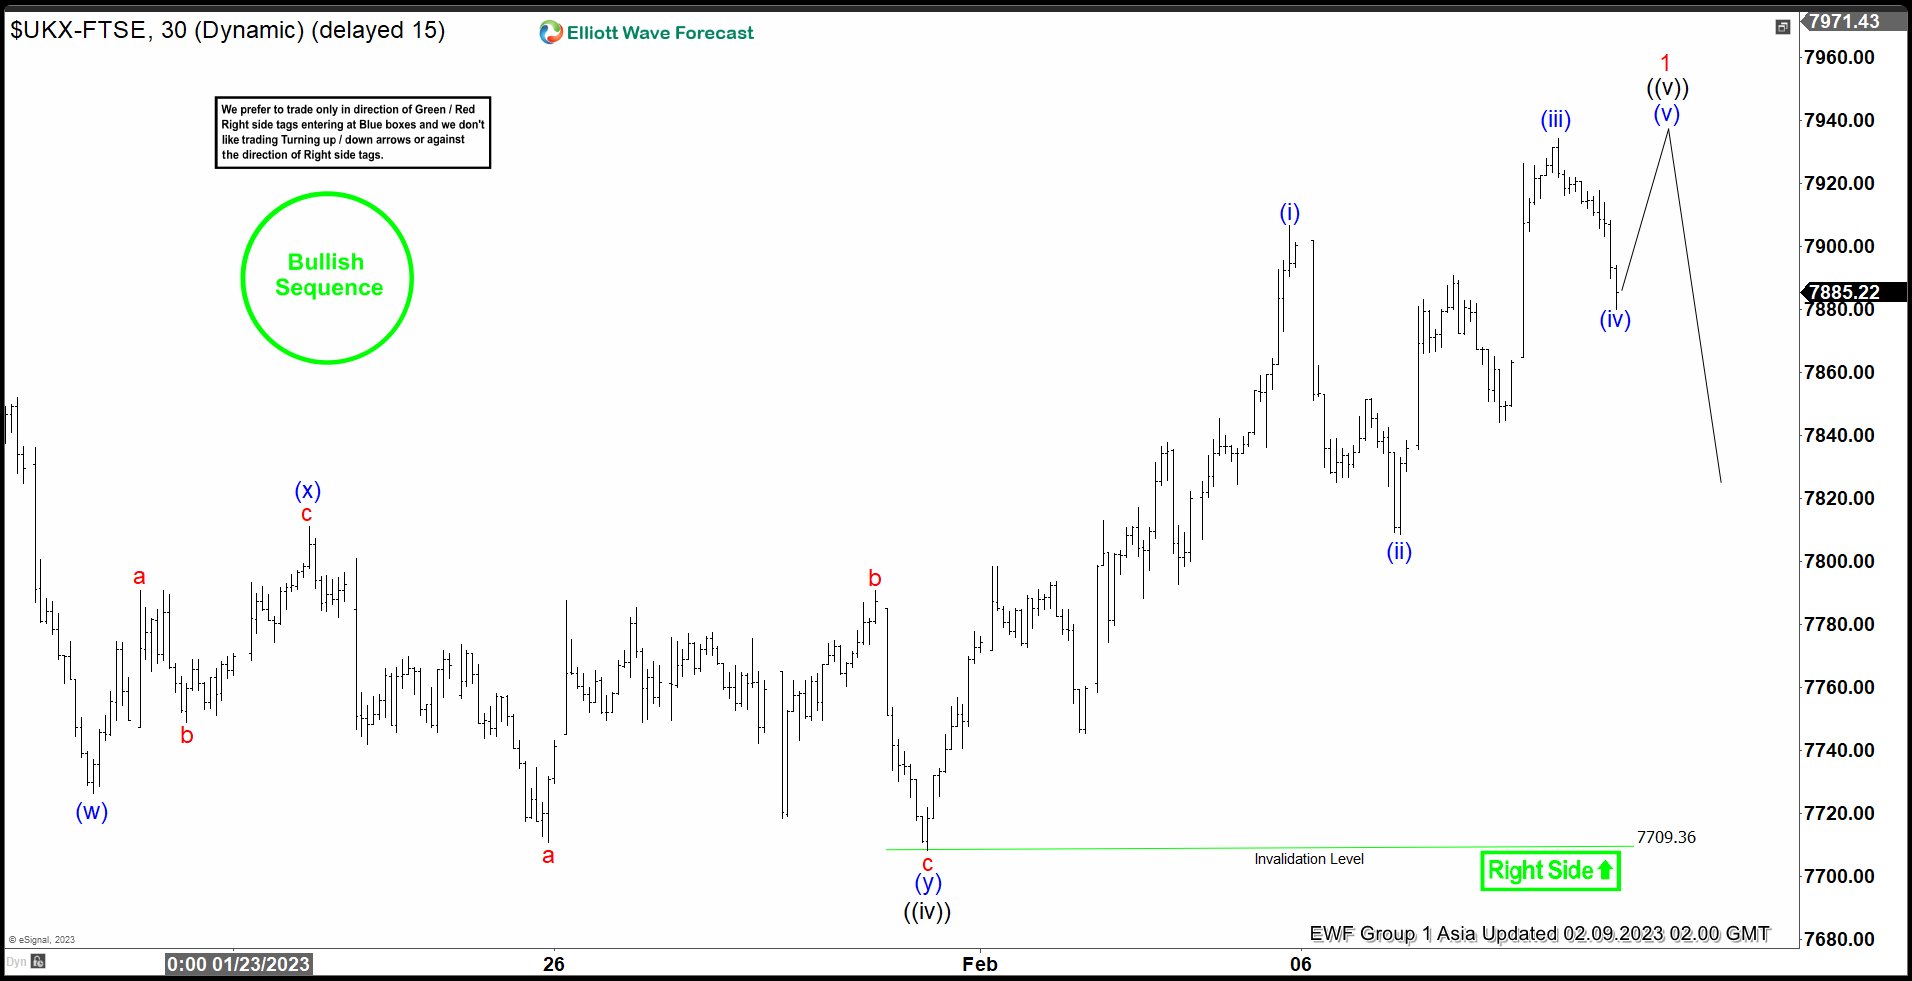
FTSE Elliott Wave 1 Hour Chart 02.09.2022
FTSE found buyers and made rally toward new highs as expected. Structure still looks incomplete. So far we can count 3 waves, so another leg up would be ideal to have clear 5 waves in Ending Diagonal. We believe that FTSE is about to end wave (iv) of ((v))). If holds the current low and makes turn higher from current levels, it can see approximately 7950 area before 3 waves pull back takes place. After proposed pull back, we expect to see continuation higher again.
Keep in mind that market is dynamic and presented view could have changed in the mean time. You can check most recent charts with target levels in the membership area of the site Best instruments to trade are those having incomplete bullish or bearish swings sequences. We put them in Sequence Report and best among them are shown in the Live Trading Room
Source: https://elliottwave-forecast.com/stock-market/ftse-elliott-wave-bullish-sequences/


