
In this technical blog, we will look at the past performance of the 4-hour Elliott Wave Charts of GBPCAD. In which, the rally from the 10 February 2023 low unfolded as an impulse sequence and showed a higher high sequence with a bullish sequence stamp. Therefore, we knew that the structure in GBPCAD is incomplete to the upside & should see more upside to complete the impulse sequence. So, we advised members not to sell the pair & buy the dips in 3, 7, or 11 swings at the blue box areas. We will explain the structure & forecast below:
GBPCAD 4-Hour Elliott Wave Chart From 4.02.2023
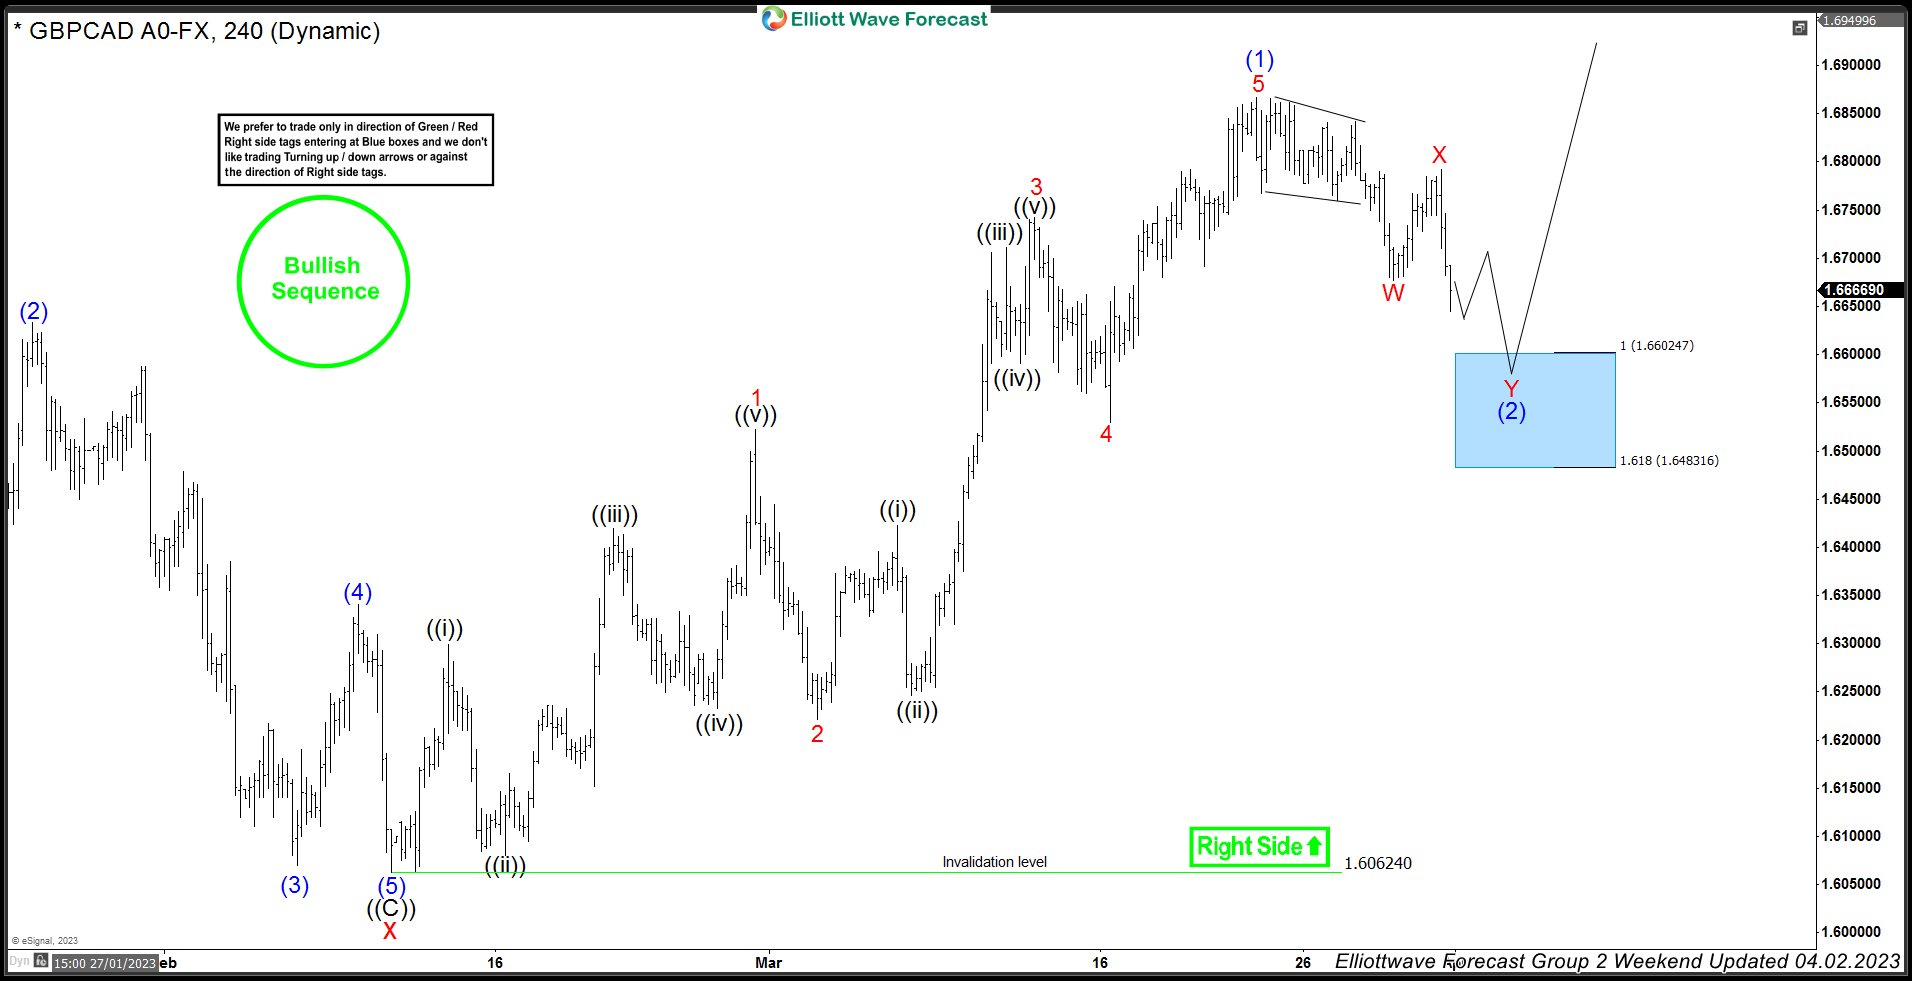
Here’s the 4hr Elliott wave Chart from the 4/02/2022 Weekend update. In which, the rally to 1.6866 high ended 5 waves from the 2/10/2023 low in wave (1) & made a pullback in wave (2). The internals of that pullback unfolded as Elliott wave double three correction where wave W ended at 1.6676 low. Then a bounce to 1.6792 high ended wave X & started the next leg lower in wave Y towards 1.6602-1.6483 blue box area. From there, buyers were expected to appear looking for new highs ideally or for a 3 wave bounce minimum.
GBPCAD 4-Hour Latest Elliott Wave Chart From 4.03.2023
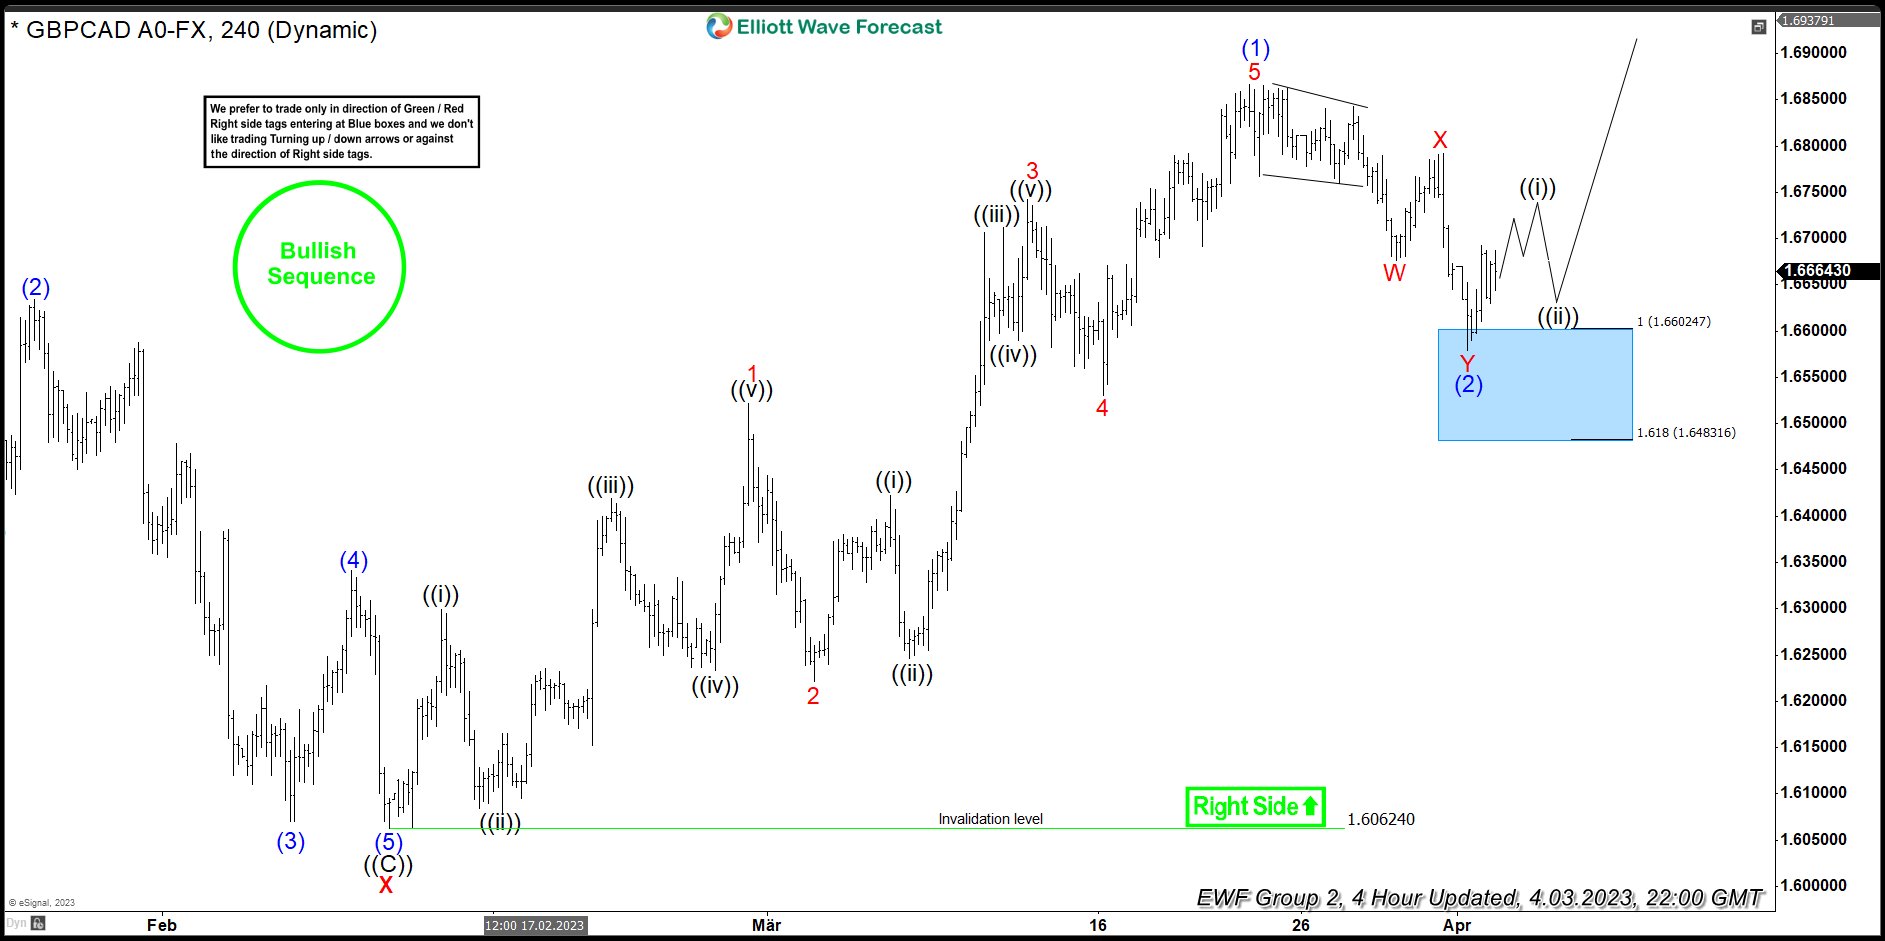
This is the latest 4hr Elliott wave Chart from the 4/03/2023 update. In which the pair is showing a reaction higher taking place, right after ending the double correction within the blue box area. Allowed members to create a risk-free position shortly after taking the long position at the blue box area.
Source: https://elliottwave-forecast.com/forex/gbpcad-touched-blue-box-area-now-turning-higher/