Barrick Gold Corporation (NYSE: GOLD) is the second-largest gold mining company in the world. The stock has underperformed since 2020 peak, but there’s a reason to believe it has made significant low on October 2022 last year. It has now started a new impulsive leg higher which should favor further upside in months and years to come. Below we will look at the weekly Elliott Wave outlook for the stock.
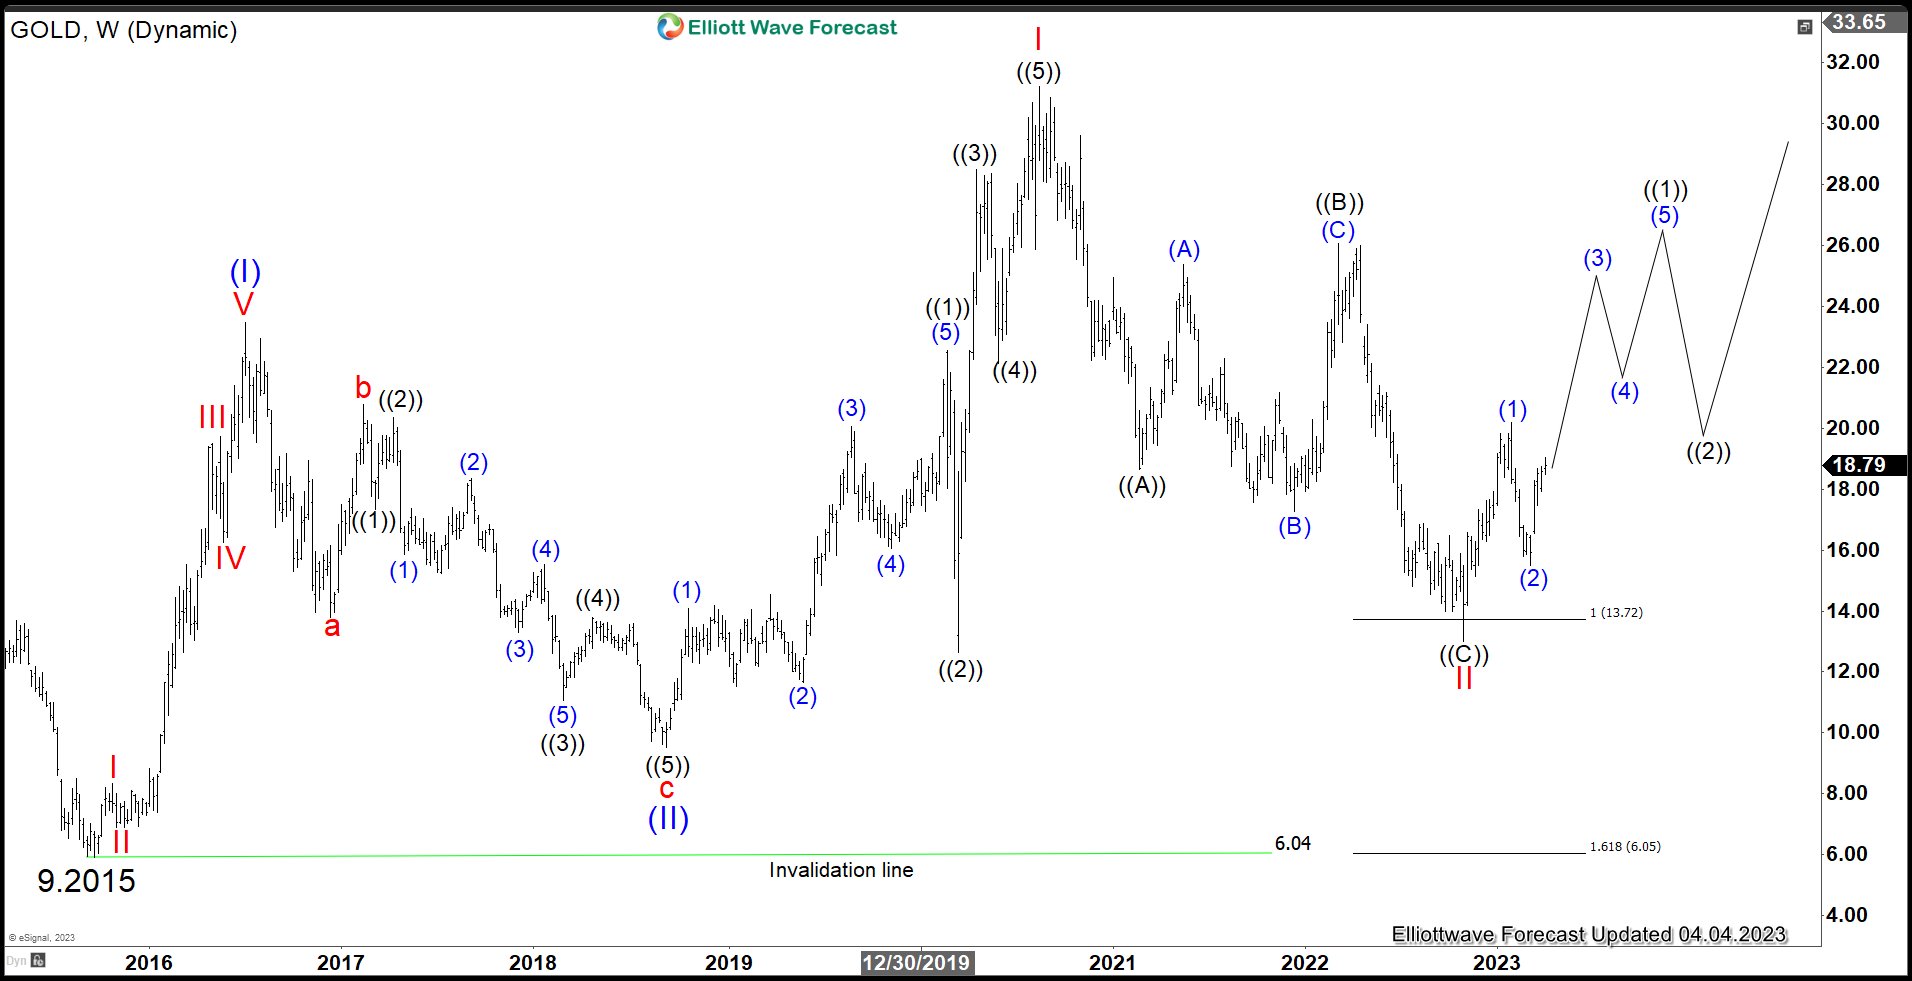
Barrick (GOLD) Weekly Elliott Wave Chart

From the weekly chart above, we can see rally from September 2015 low is unfolding as a nest. Up from September 2015 low, wave (I) ended at 23.47 and pullback in wave (II) ended at 9.53. Stock then resumes higher in wave I of (III) which ended at 31.22. Pullback in wave II of (III) ended at 13.01 with subdivision as a 3 waves zigzag. It ended at the extreme area where wave ((C)) = 100% – 161.8% Fibonacci extension of wave ((A)) at 6.05 – 13.72.
Source: https://elliottwave-forecast.com/stock-market/barrick-gold-corporation-start-impulse-rally/
