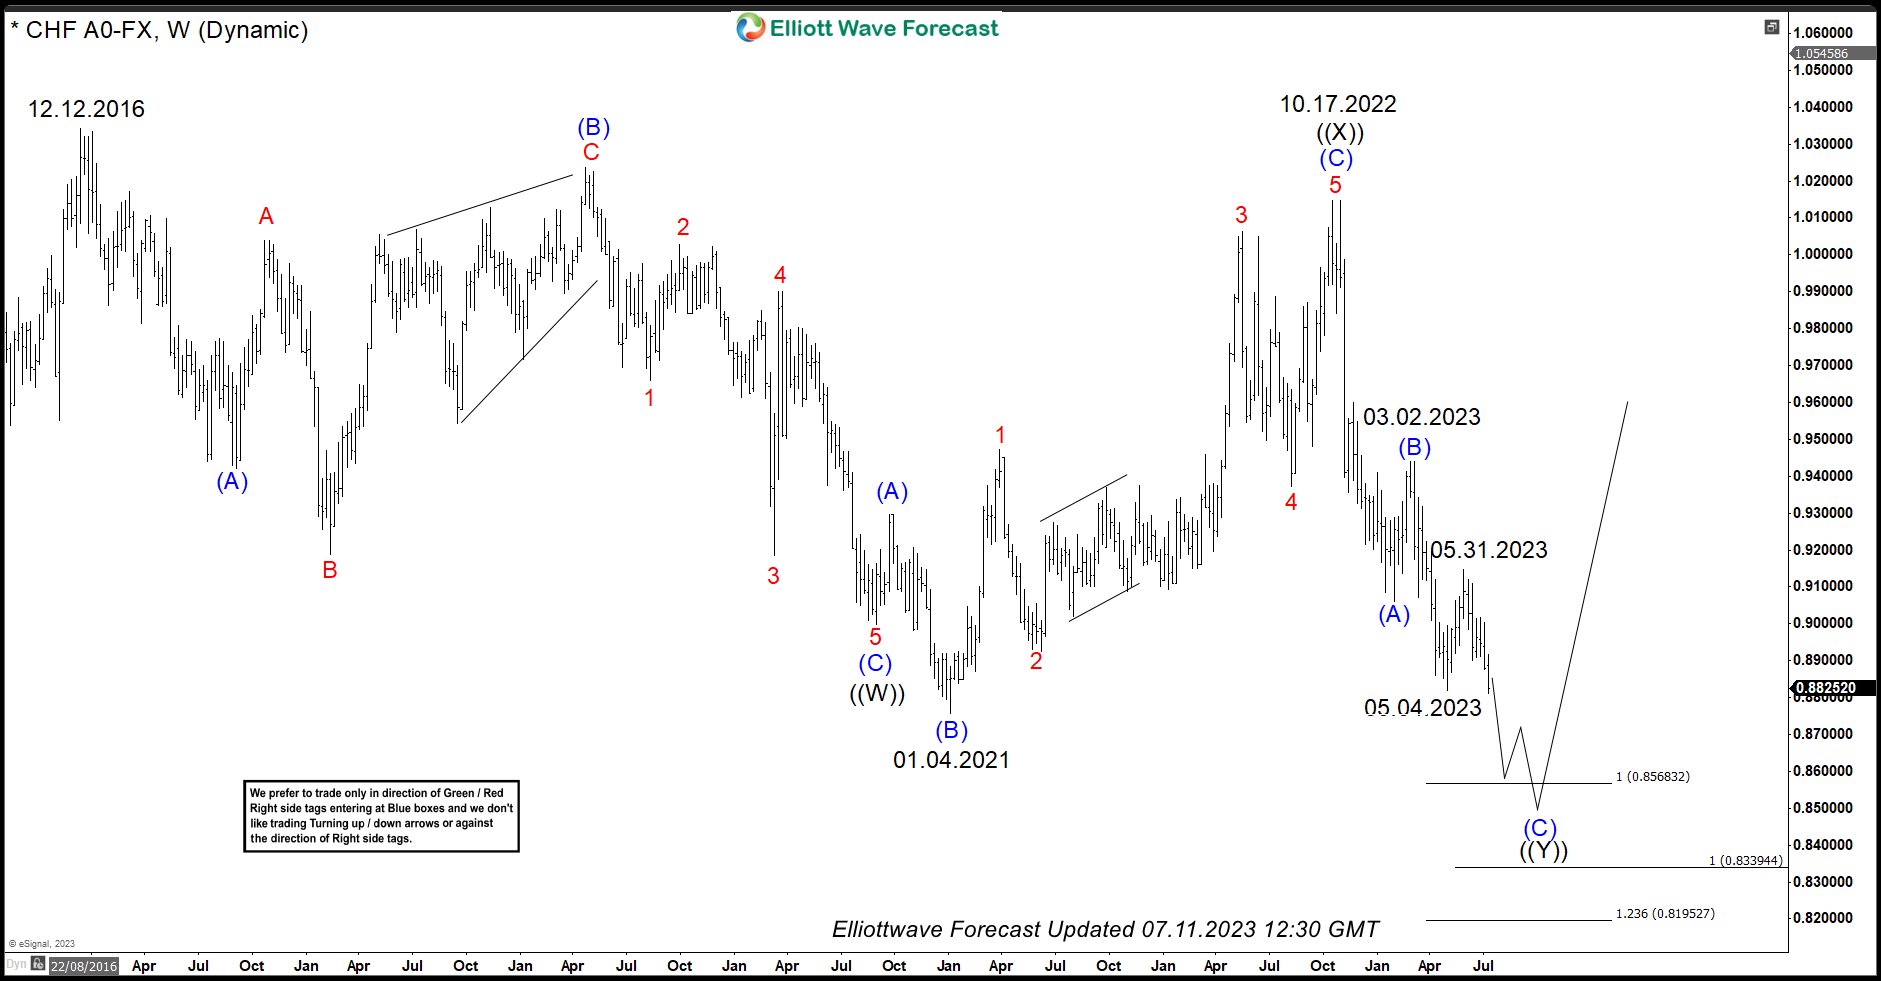
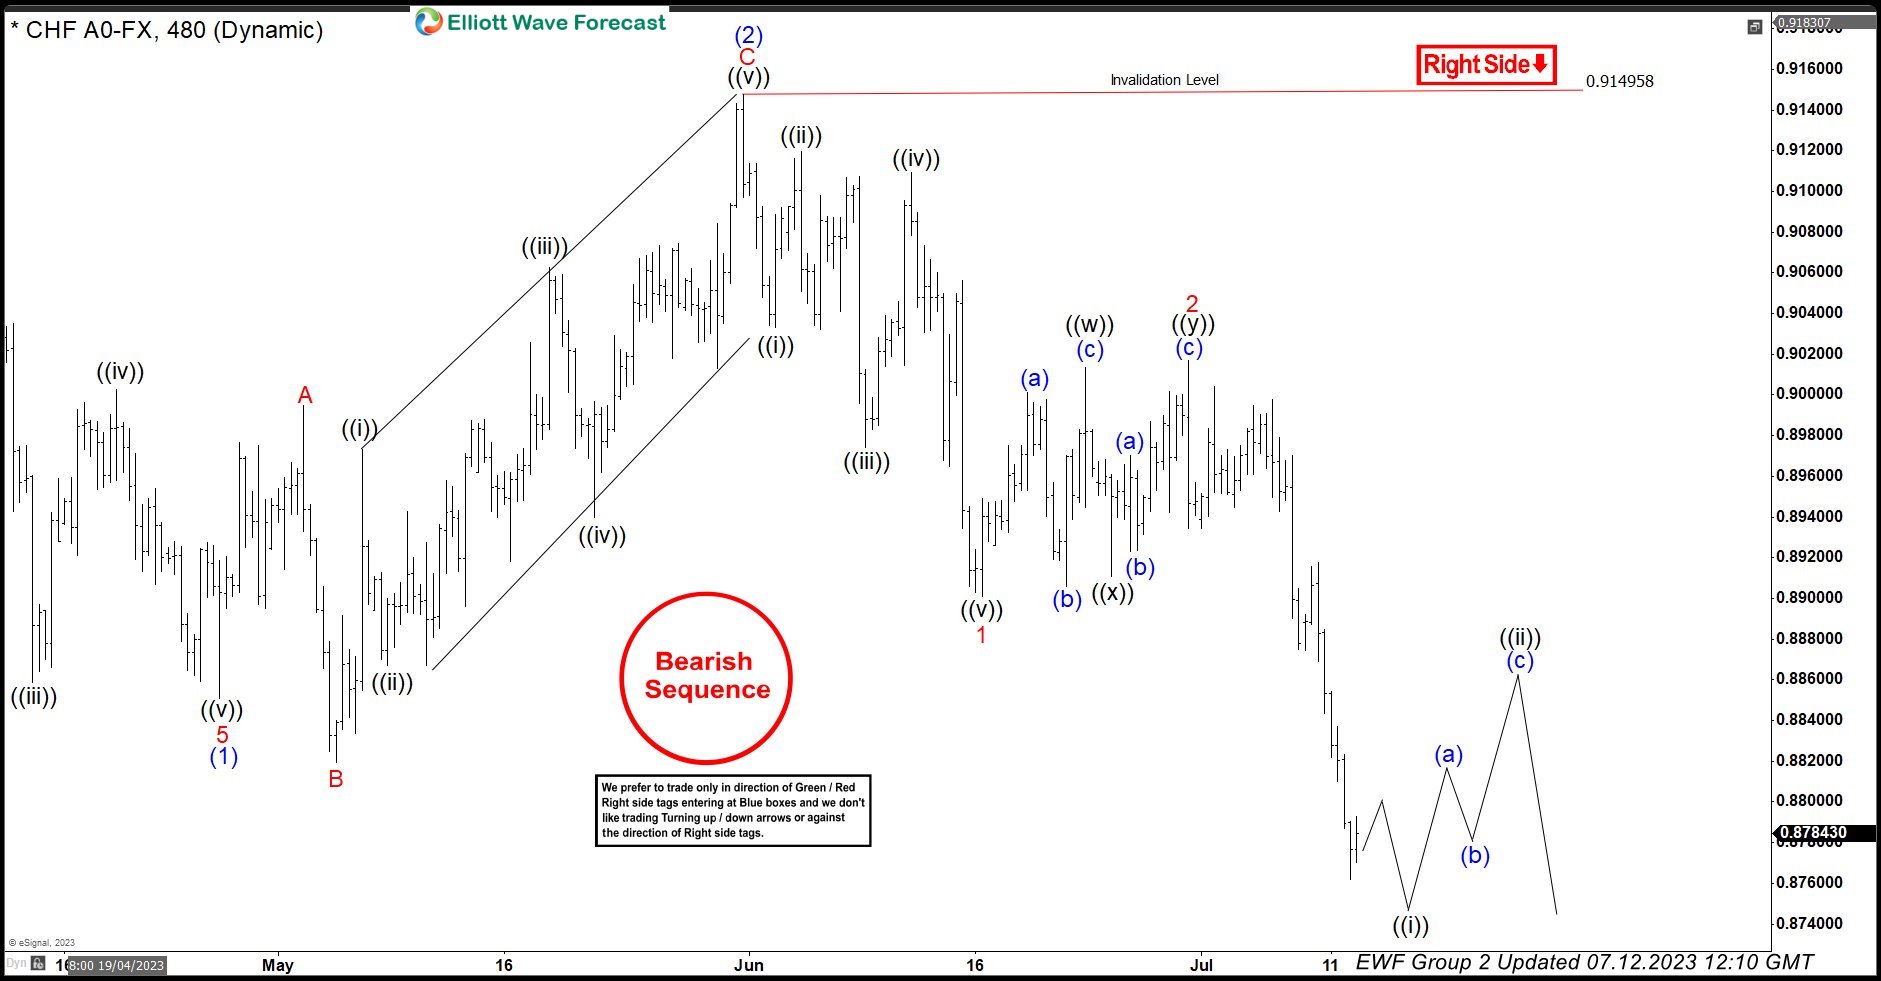
In today’s blog, we will take a look at the USDCHF Swing Sequence down from December 2016 peak and from October 2022 peak. Even when the pair has not yet broken below January 2021 low, it already has a double incomplete sequence down from October 2022 peak and also from March 2023 peak. We will look at these sequences and the extreme areas they relate to, how we like to trade the pair going forward and what it means for US Dollar Index and rest of USDX pairs.
USDCHF Weekly Chart Showing Sequence Down from December 2016 Peak

USDCHF 4 Hour Elliott Wave Chart 07.12.2023

Source: https://elliottwave-forecast.com/video-blog/usdchf-incomplete-sequence-favors-downside-usdx/

