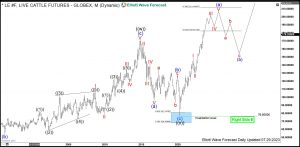
Live Cattle is a livestock commodity within the agriculture asset class, along with lean hogs, feeder cattle and porc cutouts. Once the feeder cattle have reached the target weigh of 1050-1500 pounds, they can be referred to as fed or live cattle. One can trade Live Cattle futures at Chicago Board of Trade in contracts of 40’000 pounds each under the ticker LE #F. Without any doubt, anticipation of the LE #F price development is of a high impact on the modern society. As a matter of fact, the price action of the cattle reflects the future meat price on the plate.
In the initial article from February 2021, we have expected the rally in LE #F to break to the new all-time highs. We were right. In June 2023, the prices have broken above 171.65. At the same time, this move has opened a monthly bullish sequence. Now, dips should find buyers in 3, 7 swings while LE #F prices should continue climbing up. As a matter of fact, this rally in cattle prices will make consumption of meat much more less affordable for the broad population. In the current article, we discuss the wave structure in Live Cattle futures and provide with targets.
Live Cattle Monthly Elliott Wave Analysis 07.30.2023
The monthly chart below shows the live cattle front contract LE #F. From the all-time lows, the prices have developed a cycle higher in black wave ((w)) of a grand super cycle degree. It has printed the highs in November 2014 at 171.65. From the highs, a correction lower in wave ((x)) has unfolded as an Elliott Wave zigzag pattern. In five and half years, LE #F has become cheaper by more than 50% reaching 76.60 price level. From the April 2020 lows, black wave ((y)) is currently in progress. Break above 171.65 highs has co confirmed that. In 3 years, the prices have more than doubled. Now, the target for wave ((y)) to end will be 248-354 area. In fact, extension towards 100% extension will mean that prices from April 2020 are going to triple.
In shorter cycles, intraday pullbacks should see buyers. However, LE #F prices have entered monthly intermediary 182-211 area. There, a larger pullback should take place. Therefore, investors and traders can be waiting for blue wave (a) of black wave ((y)) to end first. Then, pullback in wave (b) should find support against April 2020 lows in 3, 7 swings for more upside in blue wave (c).

Source: https://elliottwave-forecast.com/commodities/live-cattle-bullish-sequence/

