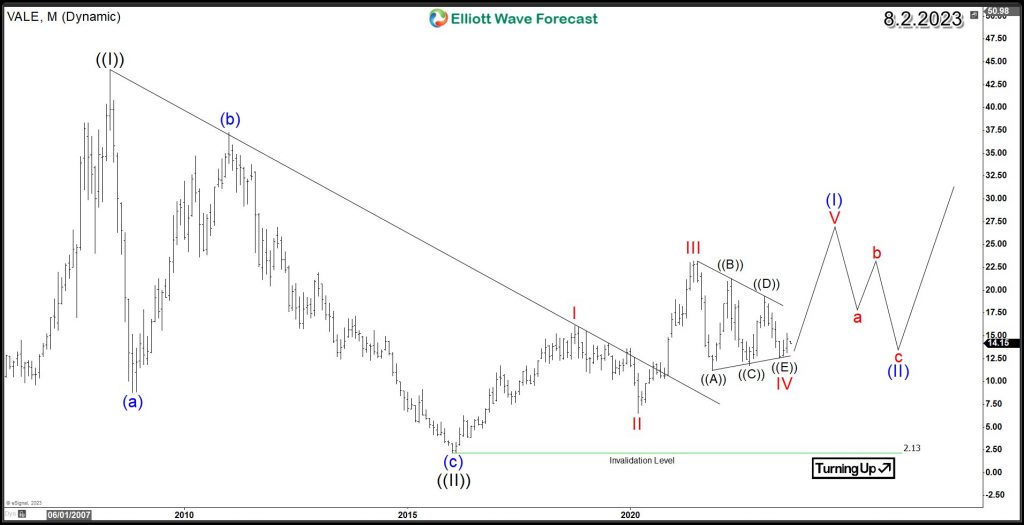
As a major player in the mining sector, Vale SA (NYSE: VALE) has been making significant strides with its robust performance and strategic position in the industry. This article will delve into Vale’s Monthly chart analysis, focusing on the bullish continuation pattern that has been unfolding.
In a prior 2019 article, we examined the prospect of surpassing the downtrend line from the 2008 peak, implying possible upward movement. As shown in the subsequent chart, the stock hit a significant low in 2016, and the anticipated breakout would trigger an impulsive upward movement.
VALE Weekly Chart 2019
In 2020, a breakout occurred, propelling the stock into a wave III surge until June 2021, peaking at $23.18. Subsequently, Vale embarked on a corrective phase in wave IV, characterized as a Contracting Triangle. Looking ahead, the stock is projected to ascend in wave V, provided it stays above the wave IV low of $12.51.
The anticipated target for wave V of (I) stands at the $26 – $30 range, potentially leading to a subsequent 3-wave pullback in wave (II) before an extended upward movement unfolds in the ensuing years.
VALE Elliott Wave Monthly Chart 8.2.2023

A breach of May 2023 low for Vale could trigger a further decline to around $9, potentially concluding wave IV. Staying above the 2020 low of $6.5 may allow for a subsequent rally, either as a fifth wave or within a nested structure since 2016.
With its strong presence in the mining market and positive price action, Vale is showing promising signs of further growth. The Elliott Wave technical structure indicates a significant potential upside for the stock, irrespective of near-term developments. With a substantial low established in 2016, a new monthly upside cycle is in progress.
Source: https://elliottwave-forecast.com/stock-market/vale-bullish-price-action/

