Viking Therapeutics Inc. is an innovative biotechnology company developing novel therapeutics for metabolic and endocrine diseases. Metabolic and rare disease programs include novel selective thyroid receptor-β agonist approach. These and other programs are currently within phases 1, 2 and preclinical. Viking Therapeutics saw IPO back in 2015. Since then, investors can trade it under the ticker $VKTX at NASDAQ.
In the initial article from March 2023, we have discussed initial impulse from June 2022 lows and explained that it is dangerous to chase the strength. We were right. The price has created new all-time high and is pulling back. Here, we discuss the wave structure and provide with support areas and next price targets.
Viking Therapeutics Weekly Elliott Wave Analysis 10.01.2023
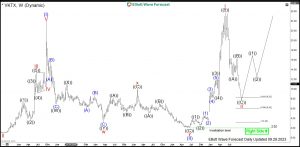
The weekly chart below shows the Viking Therapeutics shares $VKTX traded at NASDAQ. From the IPO in 2015, the stock price has developed an initial cycle higher in blue wave (I) of super cycle degree towards $24 highs in September 2018. Then, a correction lower in blue wave (II) has unfolded as an Elliott wave double three pattern being 3-3-3 structure.
Firstly, 7 swings (which is equal to larger 3 swings) in red wave w of blue wave (II) have printed a low at $3.26 in March 2020. Then, a bounce has set a connector wave x at $10.09 highs in February 2021. Later on, the price has broken $3.26 lows opening up a bearish sequence. As a consequence, red wave y should have extended lower towards 100% extension or at least 61.8% extension of the red wave w. However, these values are below zero. Due to the lack of space, the price has reached $2.02 and bounced breaking the descending channel from 2018. As a matter of fact, the correction has ended in June 2022 at $2.02 lows and new cycle in blue wave (III) has started. Break of $24 highs has confirmed that. The target for the wave (III) is 26.01-40.83 area and even beyond.
Within blue wave (III), red wave I has reached in 5 waves the new all-time highs in May 2023 at $25.72. From there, pullback in red wave II is inrogress. Firstly, black wave ((A)) has set a low in August 2023 at 12.62. Secondly, bounce in black wave ((B)) has set a connector in September 2023 at 16.36 highs. Thirdly, price has broken 12.62 lows confirming next extension lower. Now, black wave ((C)) can reach 3.22-2.02 area. Alternatively, it may truncate at 0.618-0.786 area being 8.23-6.03 price range. Investors and traders can start accumulating their positions starting from below $8.23 level and against $2.02 lows. Once consolidation in red wave II ends, expect acceleration higher in red wave III of blue wave (III) towards 25.72 highs and beyond.

Source: https://elliottwave-forecast.com/stock-market/oppportunity-viking-therapeutics/

