Hello fellow traders. In this technical article we’re going to take a look at the Elliott Wave charts charts of Dollar Index ($USDX ) published in members area of the website. As our members know USDX has ended cycle from the 99.5 low as 5 waves structure. We were calling cycle completed at the 107.34 peak. Recently we got short term bounce against that high that has unfolded as Double Three Structure. In further text we’re going to explain the Elliott Wave pattern and forecast
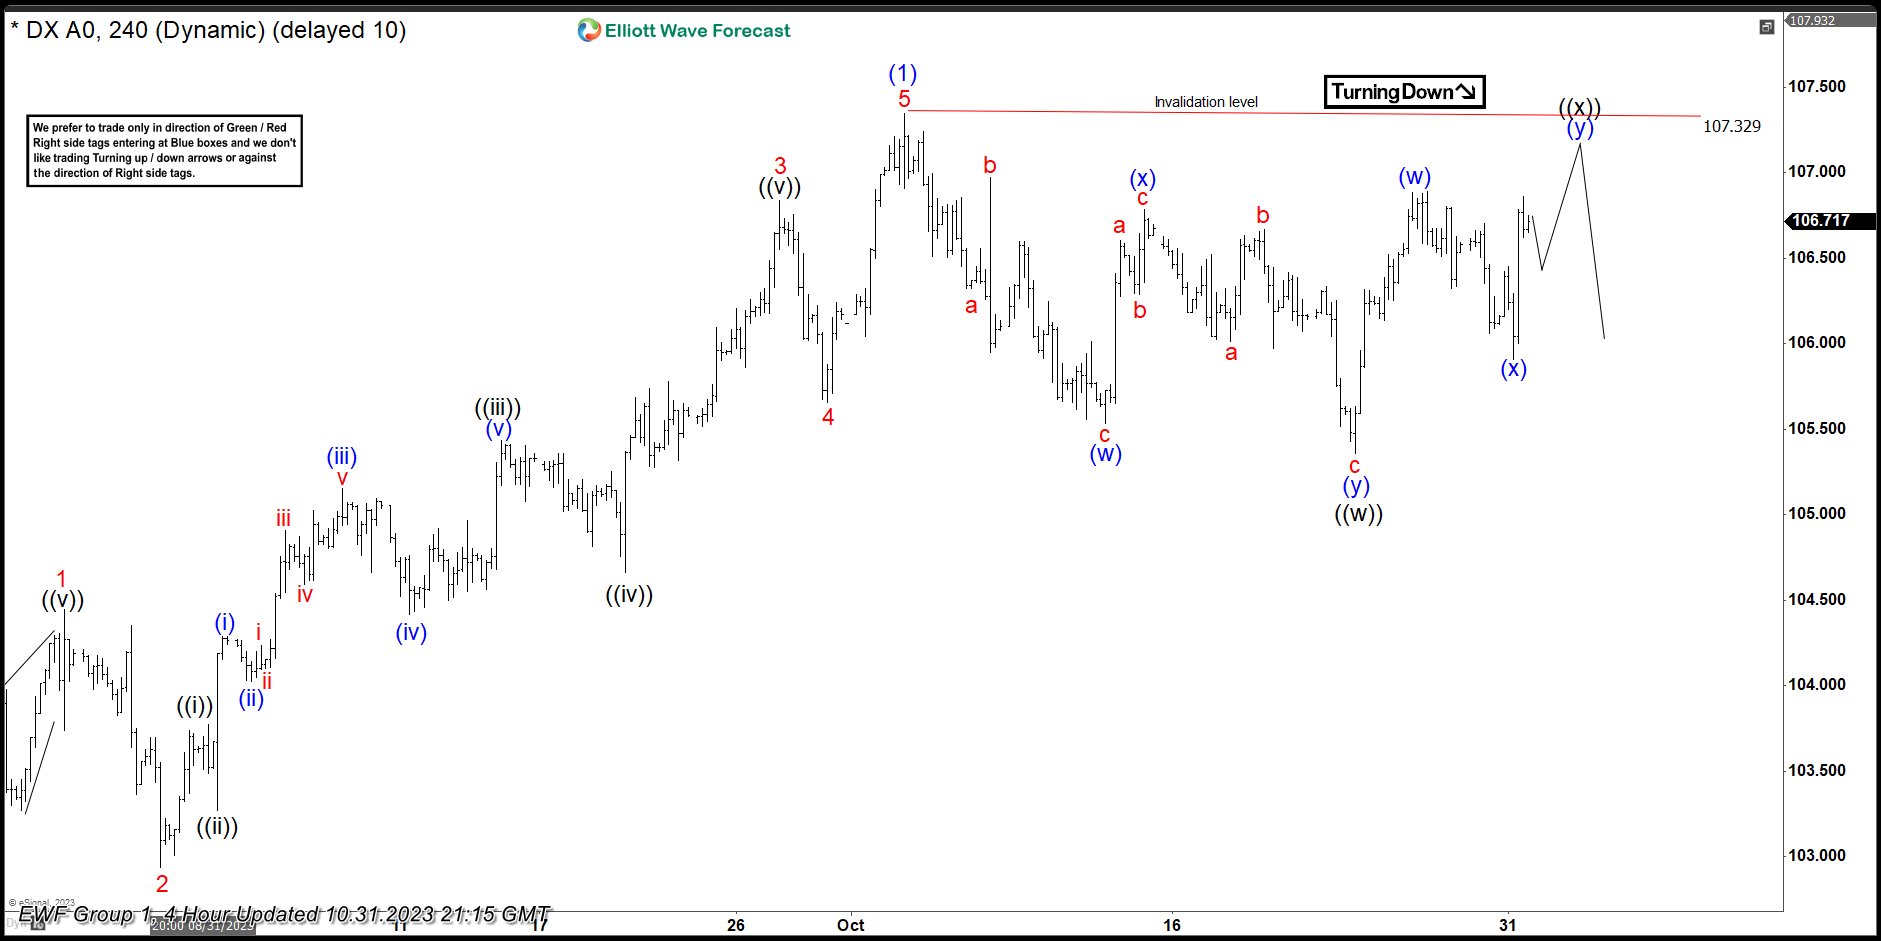
USDX Elliott Wave h4 Chart 10.31.2023
Dollar is doing short term recovery against the 107.32 peak that is unfolding as a Double Three – 7 swings pattern. Pull back has (W)(X)(Y) blue labeling. The structure is still incomplete at the moment. We expect to see another leg up (y) of ((x)) that can retest 107.32 peak, before decline takes place. 107.32 is the key level to hold for a proposed view. As far as the price stays below that peak we expect to get at least another leg down within proposed correction.
You can learn more about Elliott Wave Double Three Patterns at our Free Elliott Wave Educational Web Page.
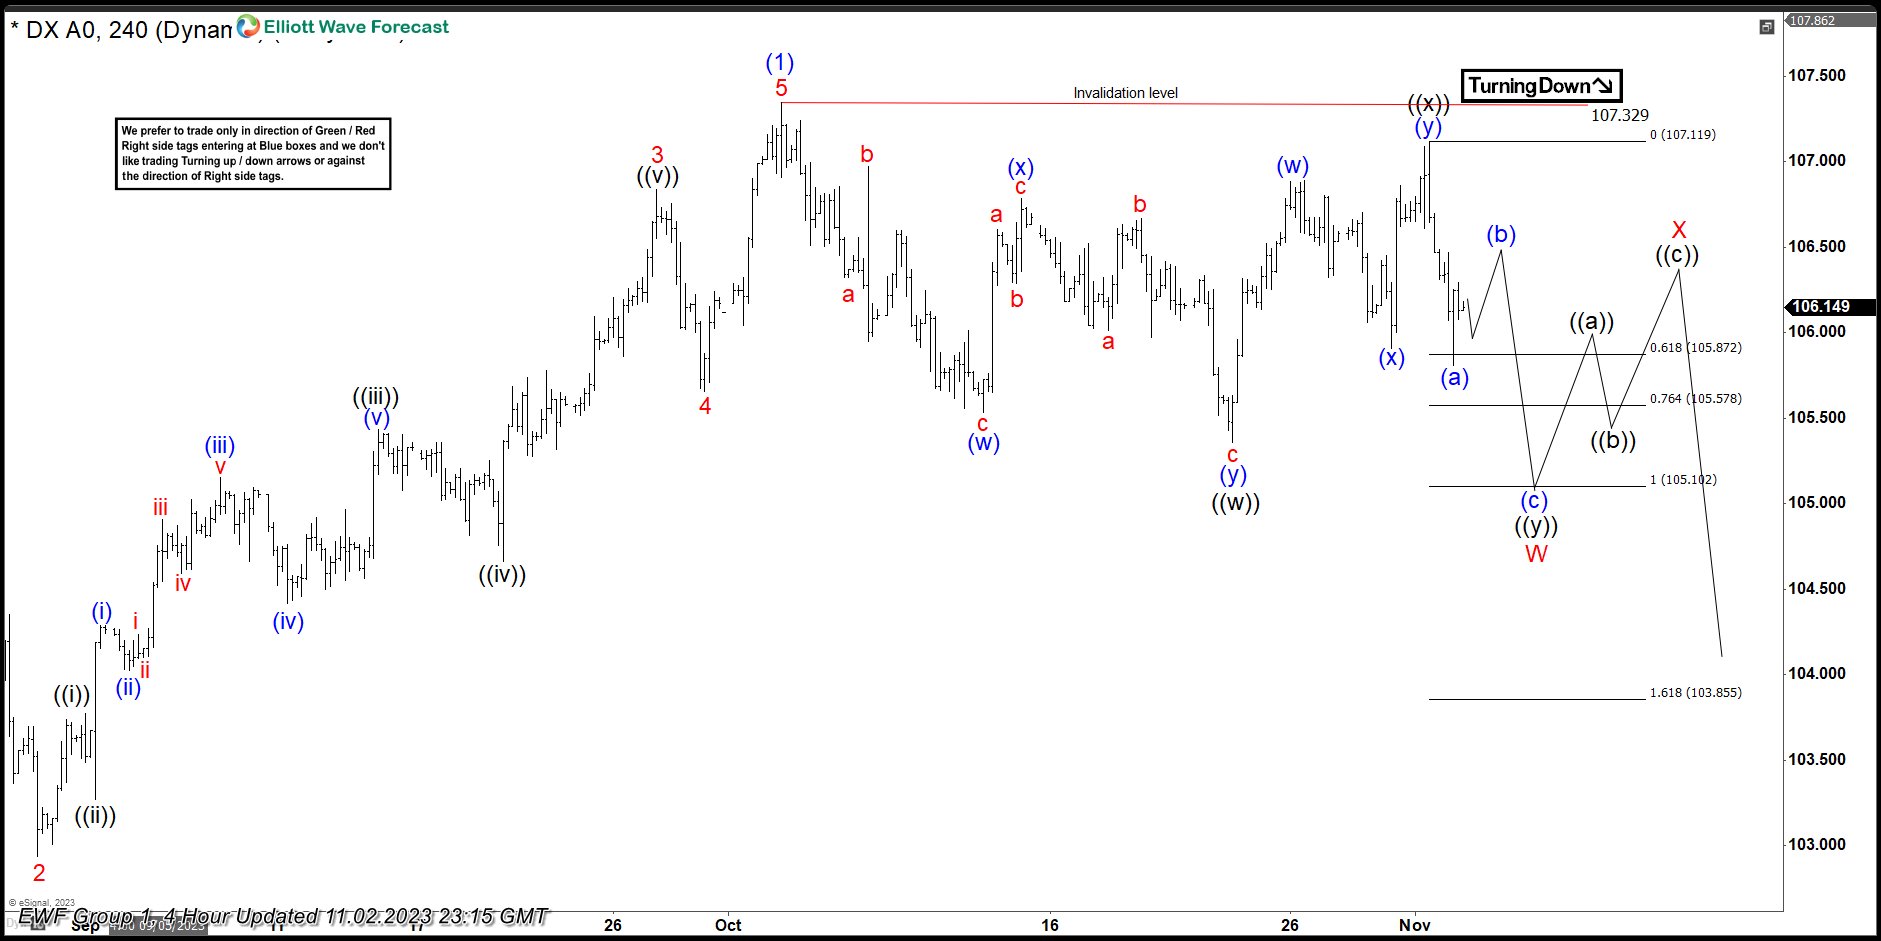
USDX Elliott Wave h4 Chart 11.02.2023
We got another leg up within ((x)) black recovery. 107.32 peak held well and Dollar found sellers as expected. We are calling ((x)) recovery completed at 107.119 high. As far as the price stays below that high, next technical area to the downside comes at 105.102-103.85
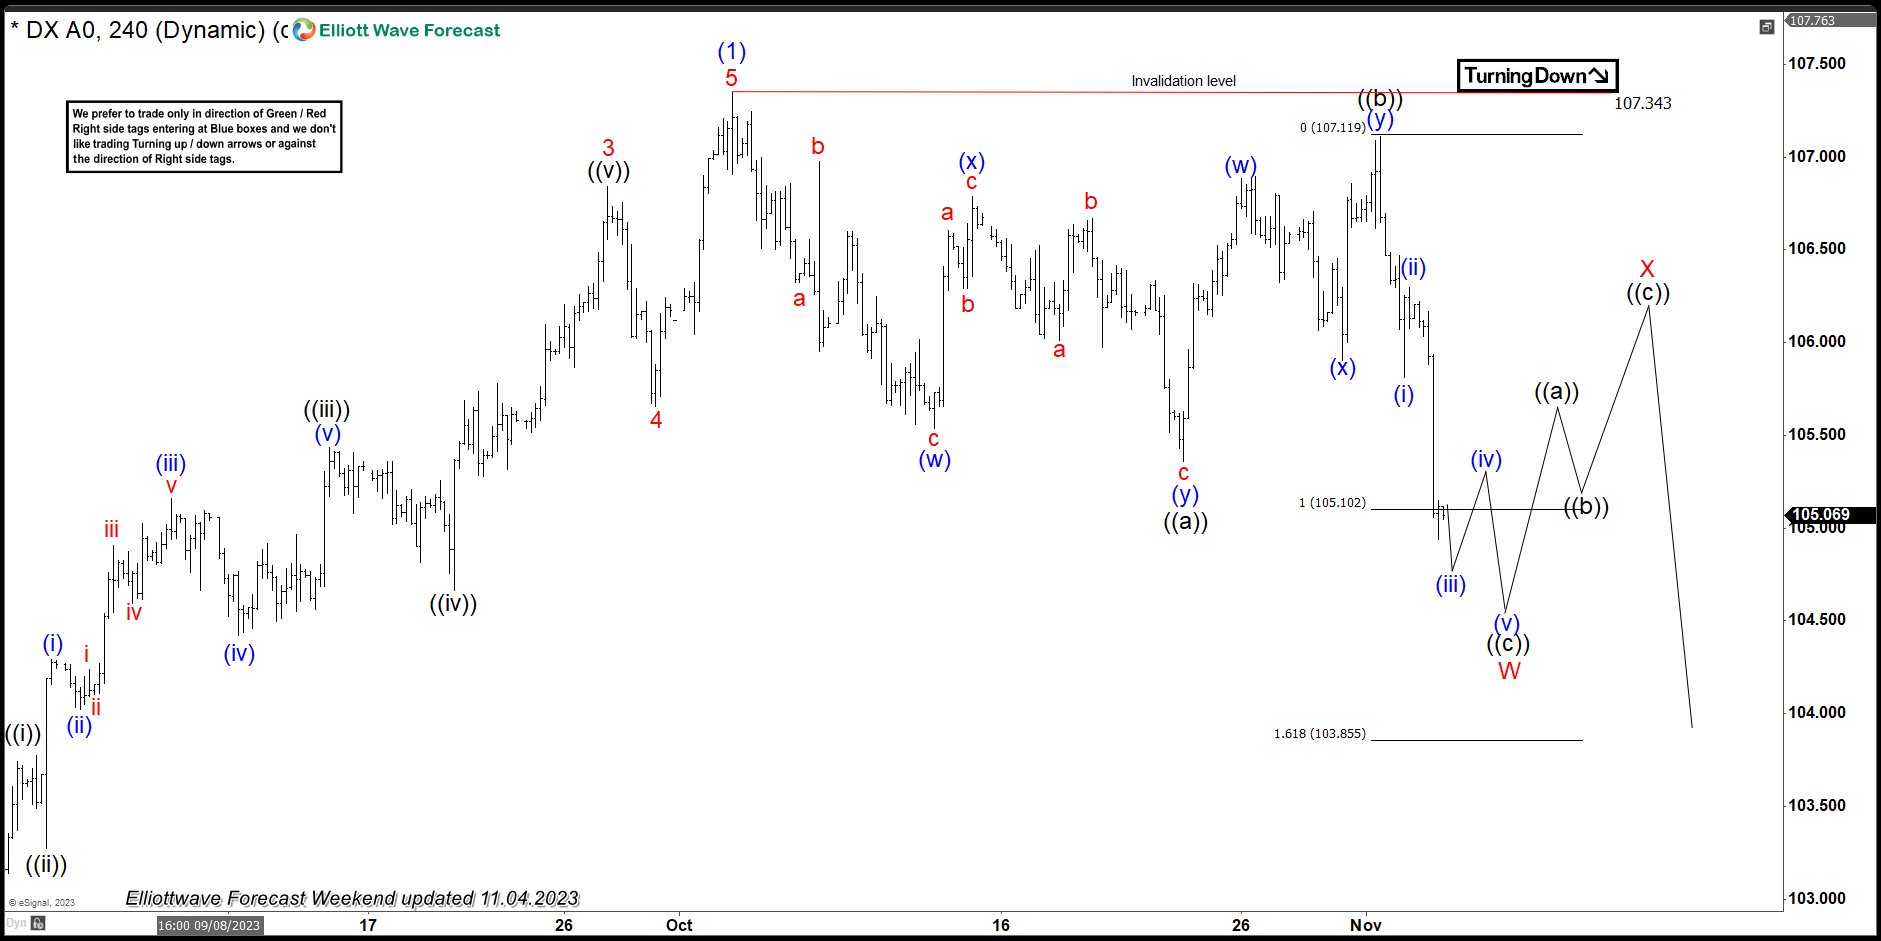
USDX Elliott Wave h4 Chart 11.02.2023
USDX made decline and the price reached extreme zone from the peak at 105.102-103.85 .Current view suggests that pull back against the 99.5 low can be still in progress, when we are ending first leg W of (2) at the marked zone. Dollar can find buyers soon at 105.102-103.85 for a 3 waves bounce in X red connector.
Keep in mind not every chart is trading recommendation. You can check most recent charts and new trading setups in the membership area of the site. Best instruments to trade are those having incomplete bullish or bearish swings sequences. We put them in Sequence Report and best among them are shown in the Live Trading Room.
Source: https://elliottwave-forecast.com/forex/usdx-elliott-wave-forecasting-path/


