Palantir Technologies (PLTR), Inc. is a holding company, which engages in the development of data integration and software solutions. It operates through the Commercial and Government segments. The firm offers automotive, financial compliance, legal intelligence, mergers and acquisitions solutions.
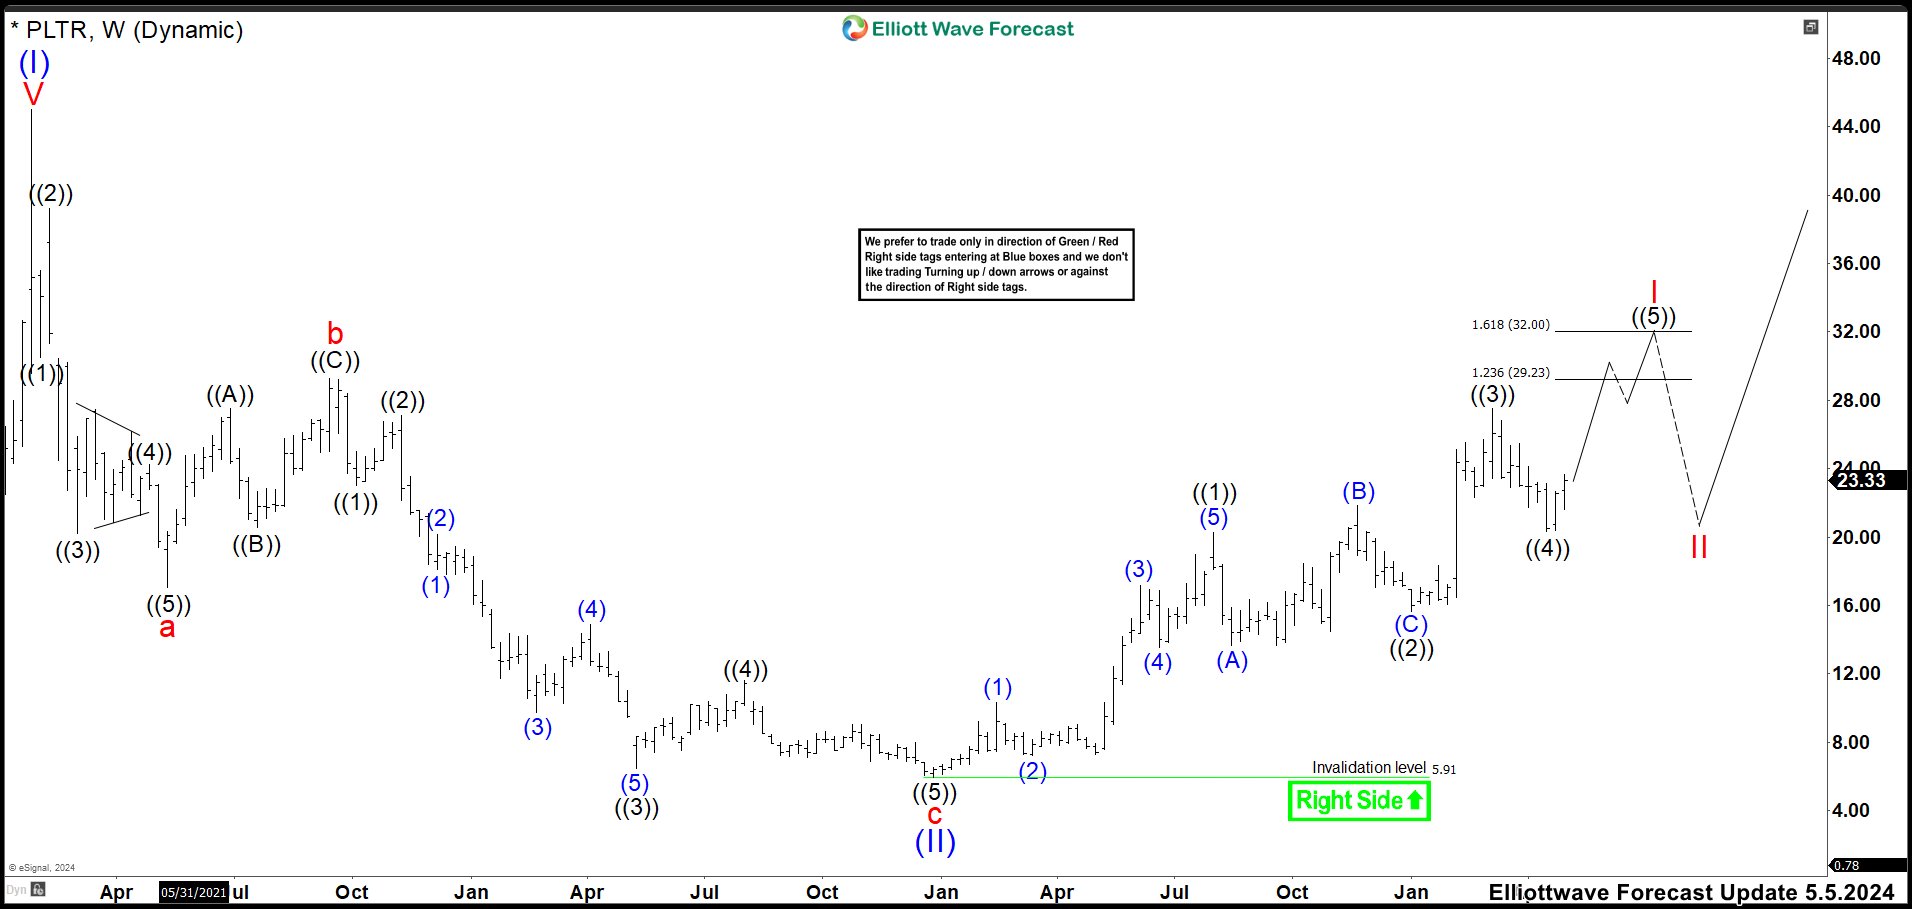
PALANTIR (PLTR) Weekly Chart May 2024

Palantir ended a cycle at $45.00 in January 2021. Then it did a deep pullback as a zig zag correction ending wave (II) at 5.91 low. The market started an impulse structure as wave ((1)). The wave (1) finished at $10.31 high. The pullback as wave (2) ended at $7.17 and rallied in 5 swings completing an impulse and wave (3) at $17.17. Then, market made a little stop for a retracement and built a flat Elliott wave structure as wave (4) ended at $13.55 in June. At this point, PLTR made a last push higher as an impulse completing wave (5) at $20.27 and also ending the whole impulse from December 2022 low as wave ((1)).
Then wave ((2)) started and it did a running flat correction. The wave (A) ended at $13.68 low and rallied breaking wave ((1)) high completing wave (B) at $21.85. Last leg as wave (C) developed an ending diagonal structure ending at $15.66 low and wave ((2)) correction. Market rallied in 5 waves ending an impulse at $27.50 high as wave ((3)). Next pullback completed at $20.33 low and for us that was the end of wave ((4)) correction. Currently, PLTR should continue to the upside to end a wave ((5)) and complete the whole wave I before seeing a correction in 3, 7 or 11 swings as wave II. This wave ((5)) should end in $29.23 – $32.00 area. If market breaks above $32.00, then Palantir is still in wave ((3)) and we should see higher prices in the stock.
Source: https://elliottwave-forecast.com/stock-market/buying-opportunities-palantir-pltr/

