The Uranium ETF (URA) is an exchange-traded fund that aims to track the performance of companies involved in the uranium mining industry. It provides investors with exposure to the global uranium sector, including companies engaged in uranium mining, exploration, and production. URA offers a convenient way for investors to gain diversified exposure to uranium without directly owning physical assets or individual stocks. Below we will look at the long term Elliott Wave outlook for this ETF.
$URA Elliott Wave Chart Monthly Chart
Monthly Elliott Wave Chart of Uranium ETF (ETF) shows that the ETF ended wave ((II)) Grand Super Cycle at 6.95. From there, the ETF has started a new wave ((III)) higher with internal subdivision as an impulse. Up from wave ((II)), wave I ended at 31.6 and pullback in wave II ended at 17.65. The ETF has extended higher and broken above wave I, suggesting the next leg wave III higher has started. Expect the ETF to continue higher in months and years to come while it stays above wave II low at 17.65, and more importantly above wave ((III)) at 6.95.
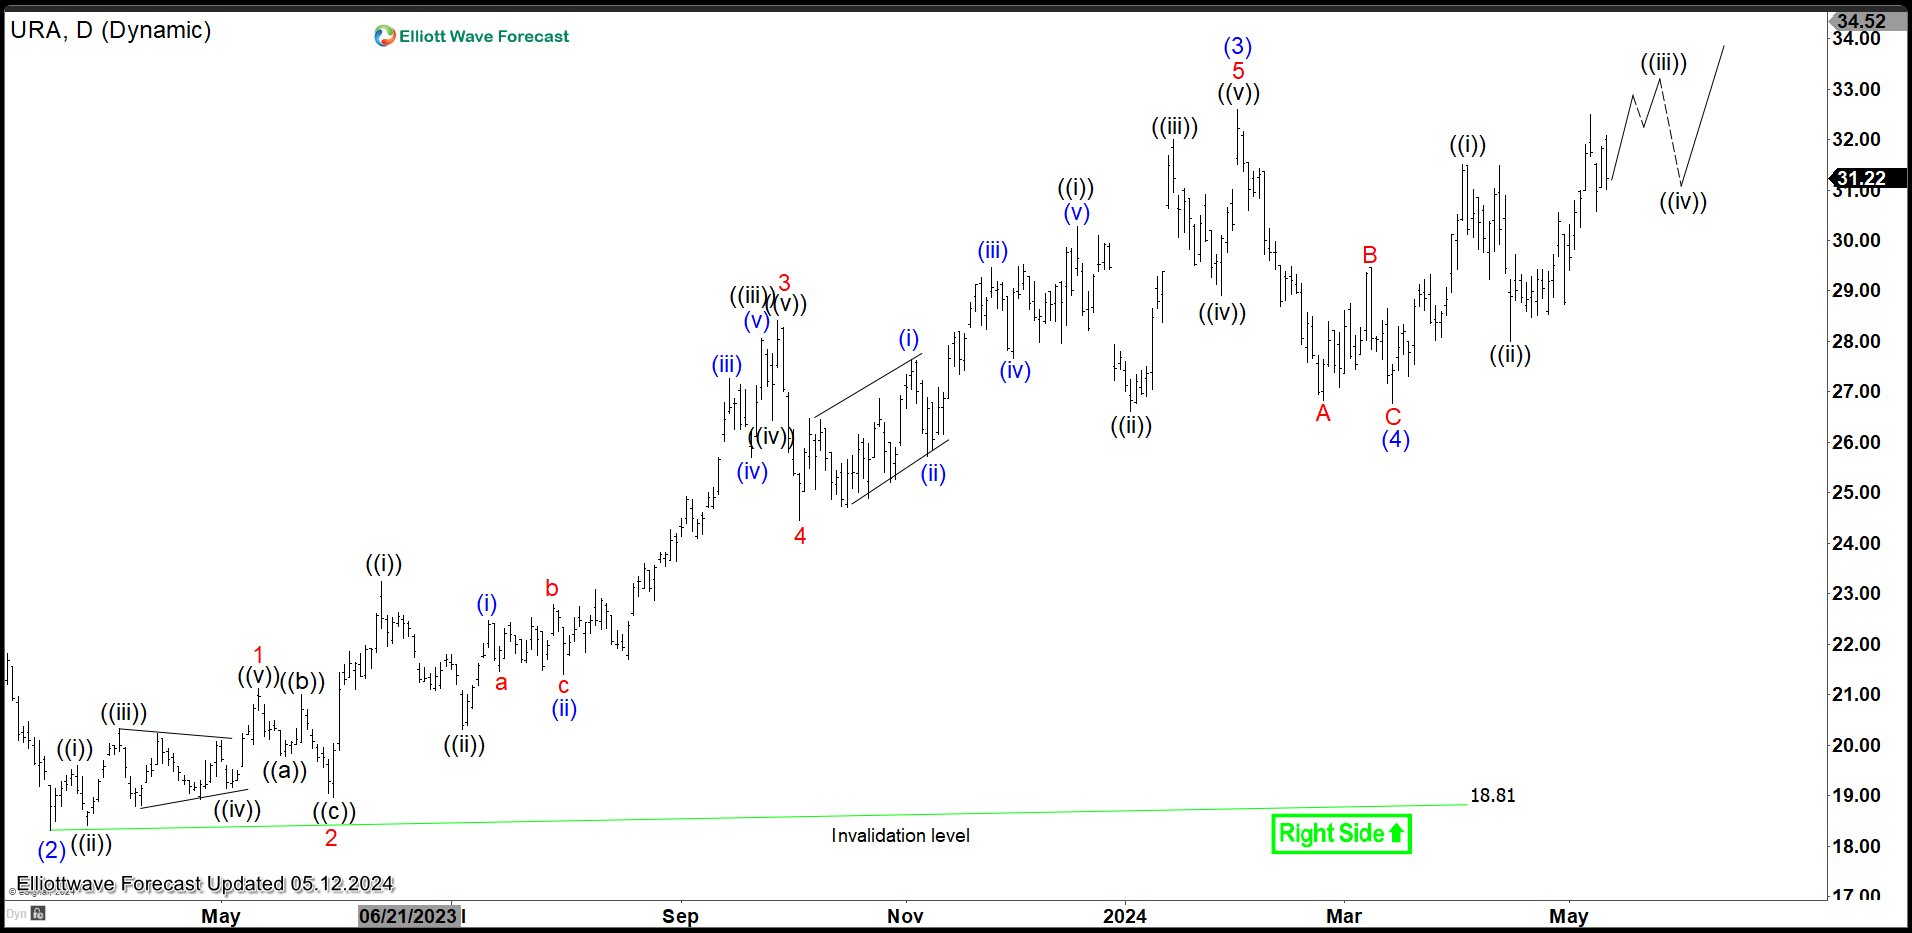
$URA Daily Elliott Wave Chart

Daily Elliott Wave Chart of $URA above shows wave (2) pullback completed at 18.81. Up from there, wave (3) ended at $32.6 with internal subdivision as an impulse. Pullback in wave (4) ended at $26.77 as a zigzag. Down from wave (3), wave A ended at $26.83 and wave B ended at $29.46. Wave C lower ended at $26.77 which completed wave (4). The ETF has turned higher in wave (5). Up from wave (4), wave ((i)) ended at $31.5 and wave ((ii)) ended at $28. Expect the ETF to extend higher as far as pullback stays above wave (4) at $26.77, and more importantly above wave (2) at $18.81.
Source: https://elliottwave-forecast.com/stock-market/uranium-miners-etf-ura-extends-impulsive-rally/

