
In this technical blog, we will look at the past performance of the 1-hour Elliott Wave Charts of GBPAUD. In which, the rally from the 09 May 2024 low unfolded in a corrective sequence but provided an extreme trading opportunity. In this case, the pullback managed to reach the equal legs area & provided a buying opportunity. So, we advised members not to sell it but to buy the equal legs area for a minimum reaction higher to happen. We will explain the structure & forecast below:
GBPAUD 1-Hour Elliott Wave Chart From 6.03.2024
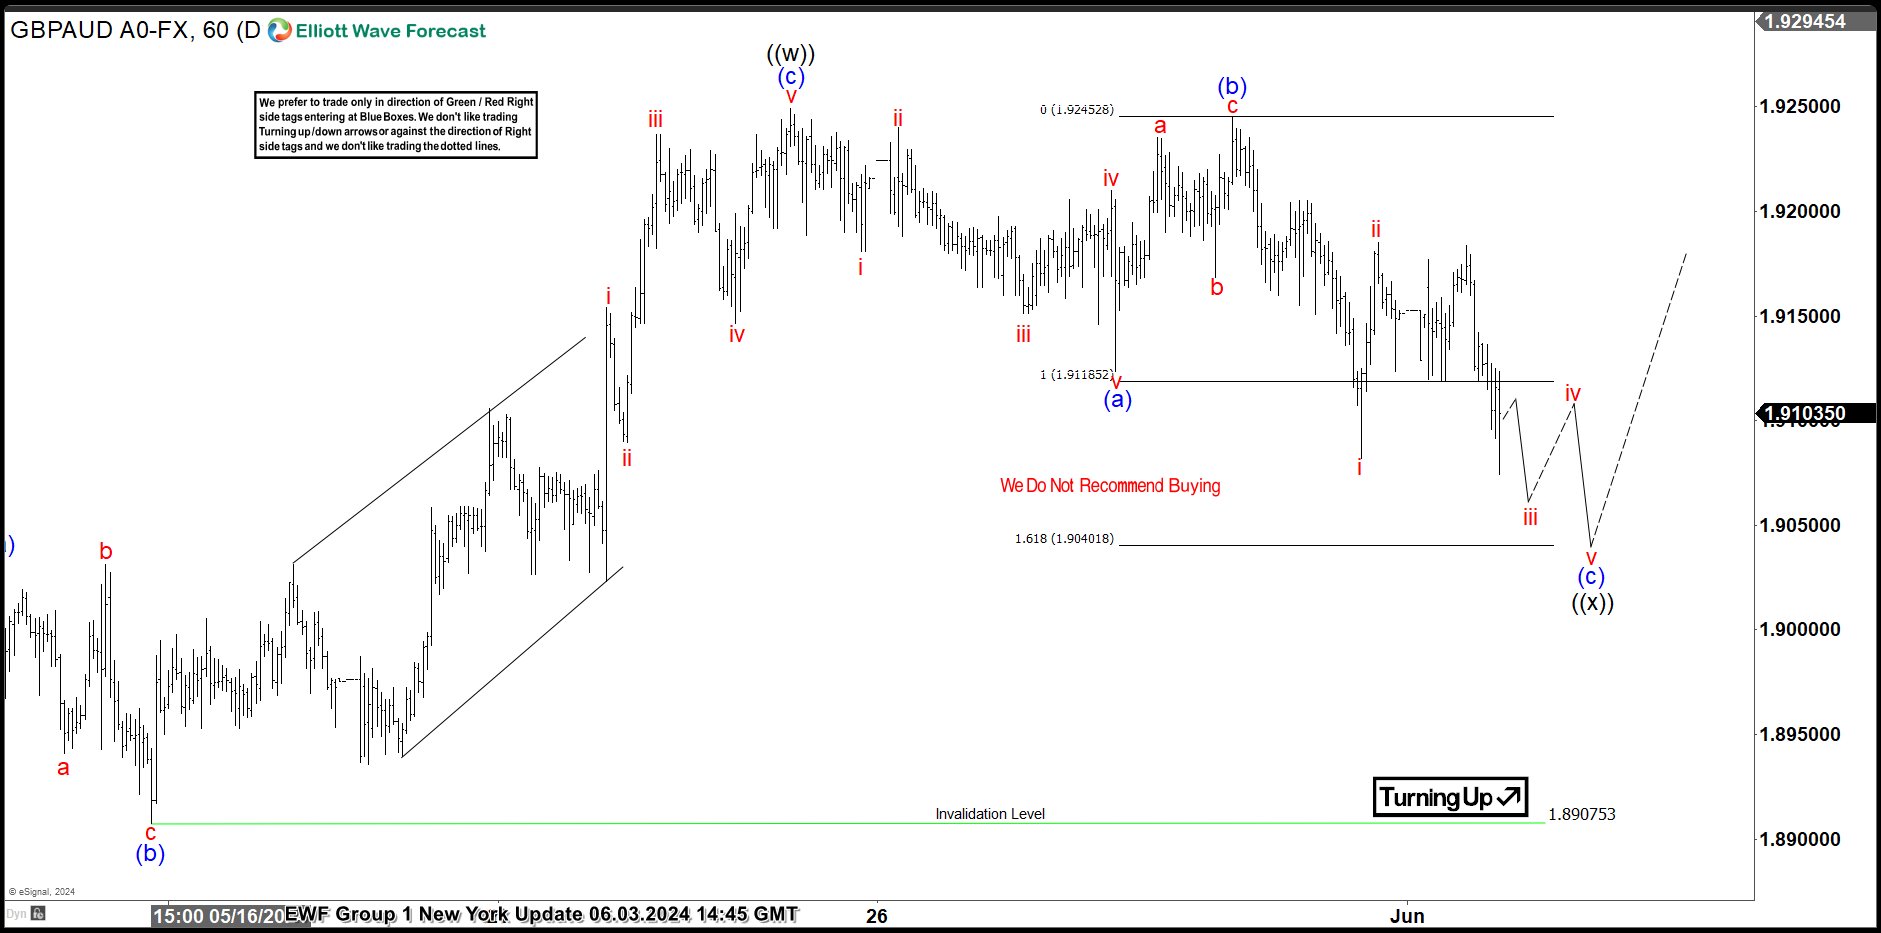
Here’s the 1-hour Elliott wave Chart from the 6.03.2024 NY update. In which, rally to 1.9249 high ended the wave ((w)) & made a pullback in wave ((x)). The internals of that pullback unfolded as Elliott wave zigzag structure where wave (a) ended at 1.9123 low. A bounce to 1.9245 high ended wave (b) bounce. Then the pair started the next leg lower in wave (c) towards 1.9118- 1.9040 equal legs area. From there, buyers were expected to appear looking for new highs ideally or for a 3-wave bounce minimum.
GBPAUD Latest 1-Hour Elliott Wave Chart From 6.04.2024
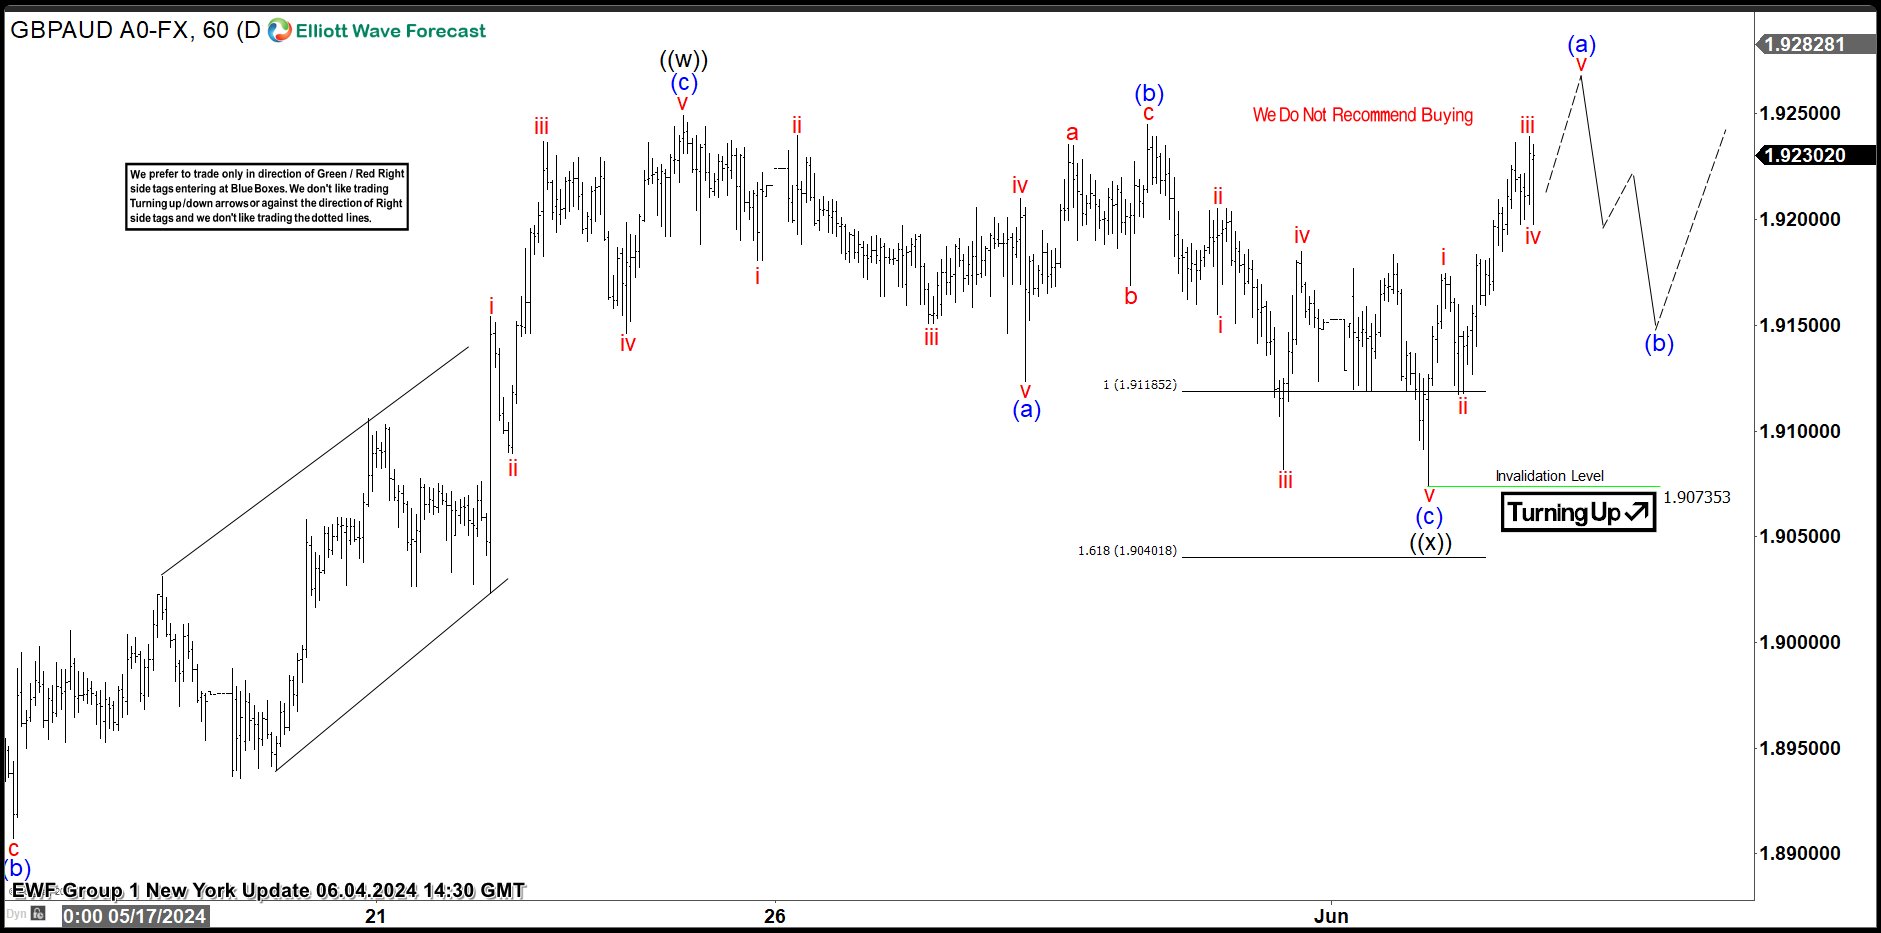
Above is the Elliott wave Chart from the 6.04.2024 NY update. The GBPAUD is showing a reaction higher taking place from the equal legs area. Right after ending the zigzag correction. Allowed members to create a risk-free position shortly after taking a long position. However, a break above 1.9249 high is yet to be seen to confirm the next extension higher & avoid a double correction lower.
Source: https://elliottwave-forecast.com/forex/gbpaud-reacting-higher-extreme-area/