
This technical blog will look at the past performance of the 1-hour Elliott Wave Charts of Microsoft ticker symbol: $MSFT. We presented to members at the elliottwave-forecast. The rally from 31 May 2024 low unfolded as an impulse structure. Showing a higher high sequence in a higher time frame favored more upside extension. Therefore, we advised members not to sell the stock & buy the dips in 3, 7, or 11 swings at the blue box areas. We will explain the structure & forecast below:
Microsoft 1-Hour Elliott Wave Chart From 6.20.2024
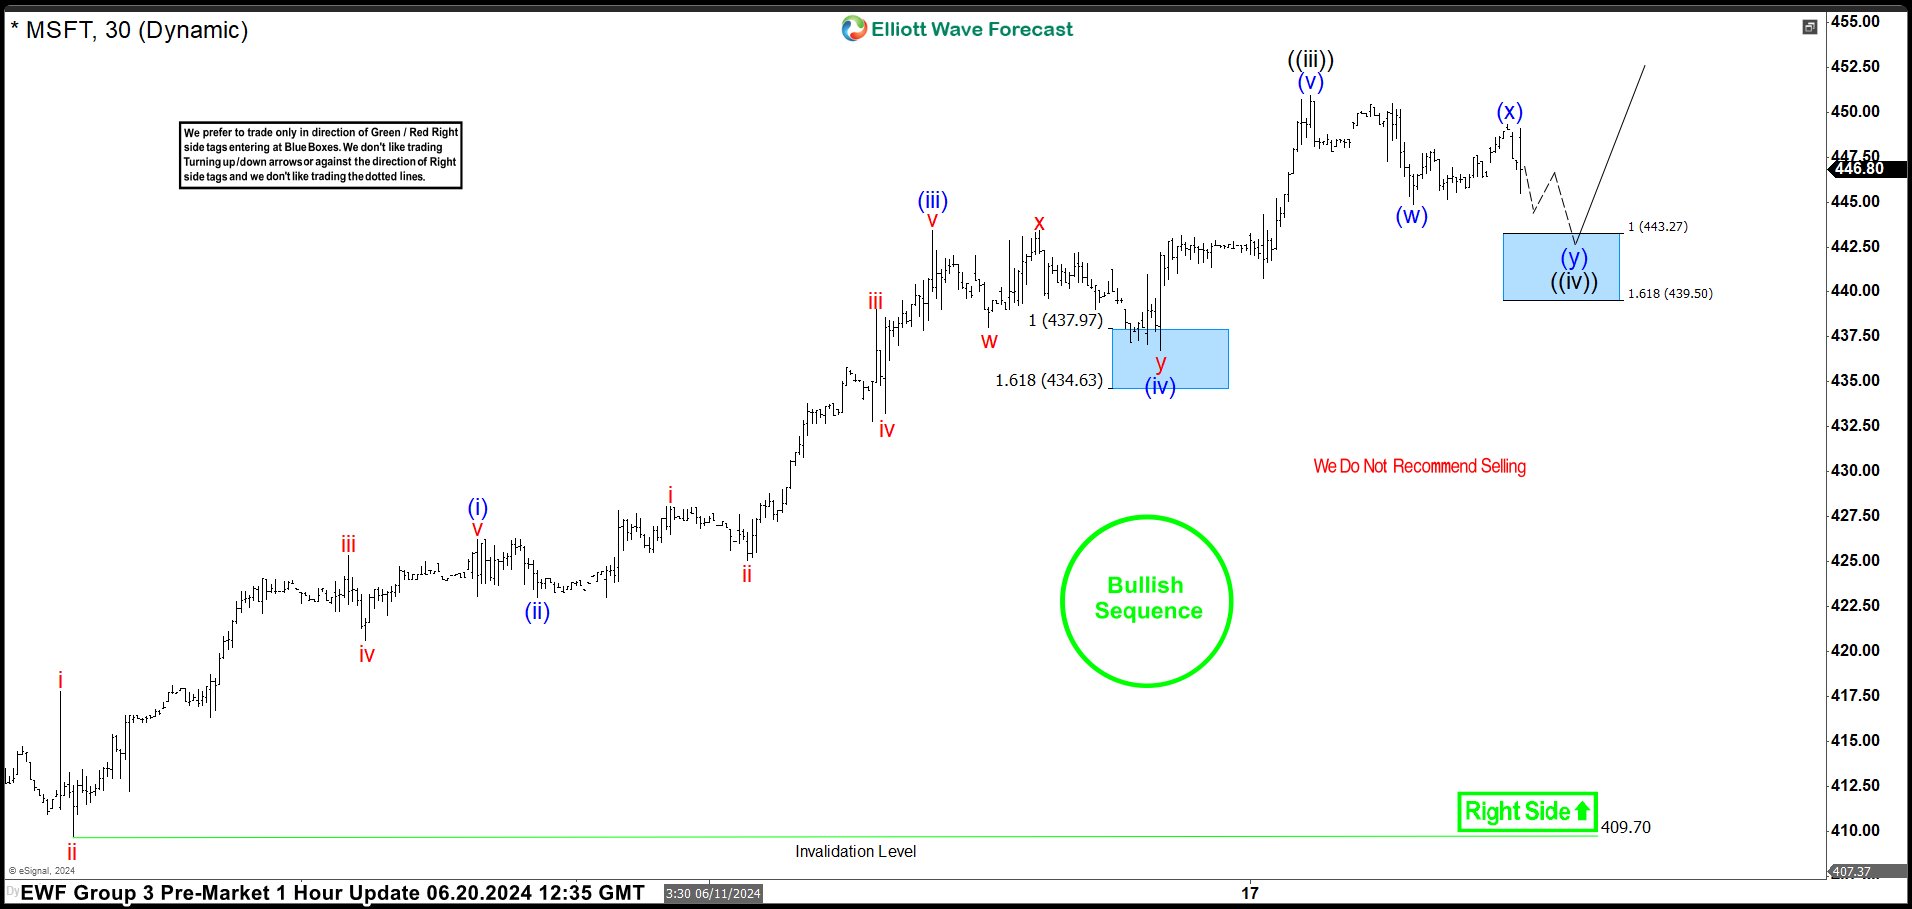
Here’s the 1-hour Elliott wave chart from the 6/20/2024 Pre-Market update. In which, the short-term cycle from the 6/03/2024 low ended in wave ((iii)) at $450.94 high. Down from there, the stock made a pullback in wave ((iv)) to correct that cycle. The internals of that pullback unfolded as Elliott wave double structure where wave (w) ended at $444.89 low. Wave (x) bounce ended at $449.30 high and wave (y) managed to reach the blue box area at $443.27- $439.50. From there, buyers were expected to appear looking for the next leg higher or for a 3 wave bounce minimum.
Microsoft Latest 1-Hour Elliott Wave Chart From 6.24.2024
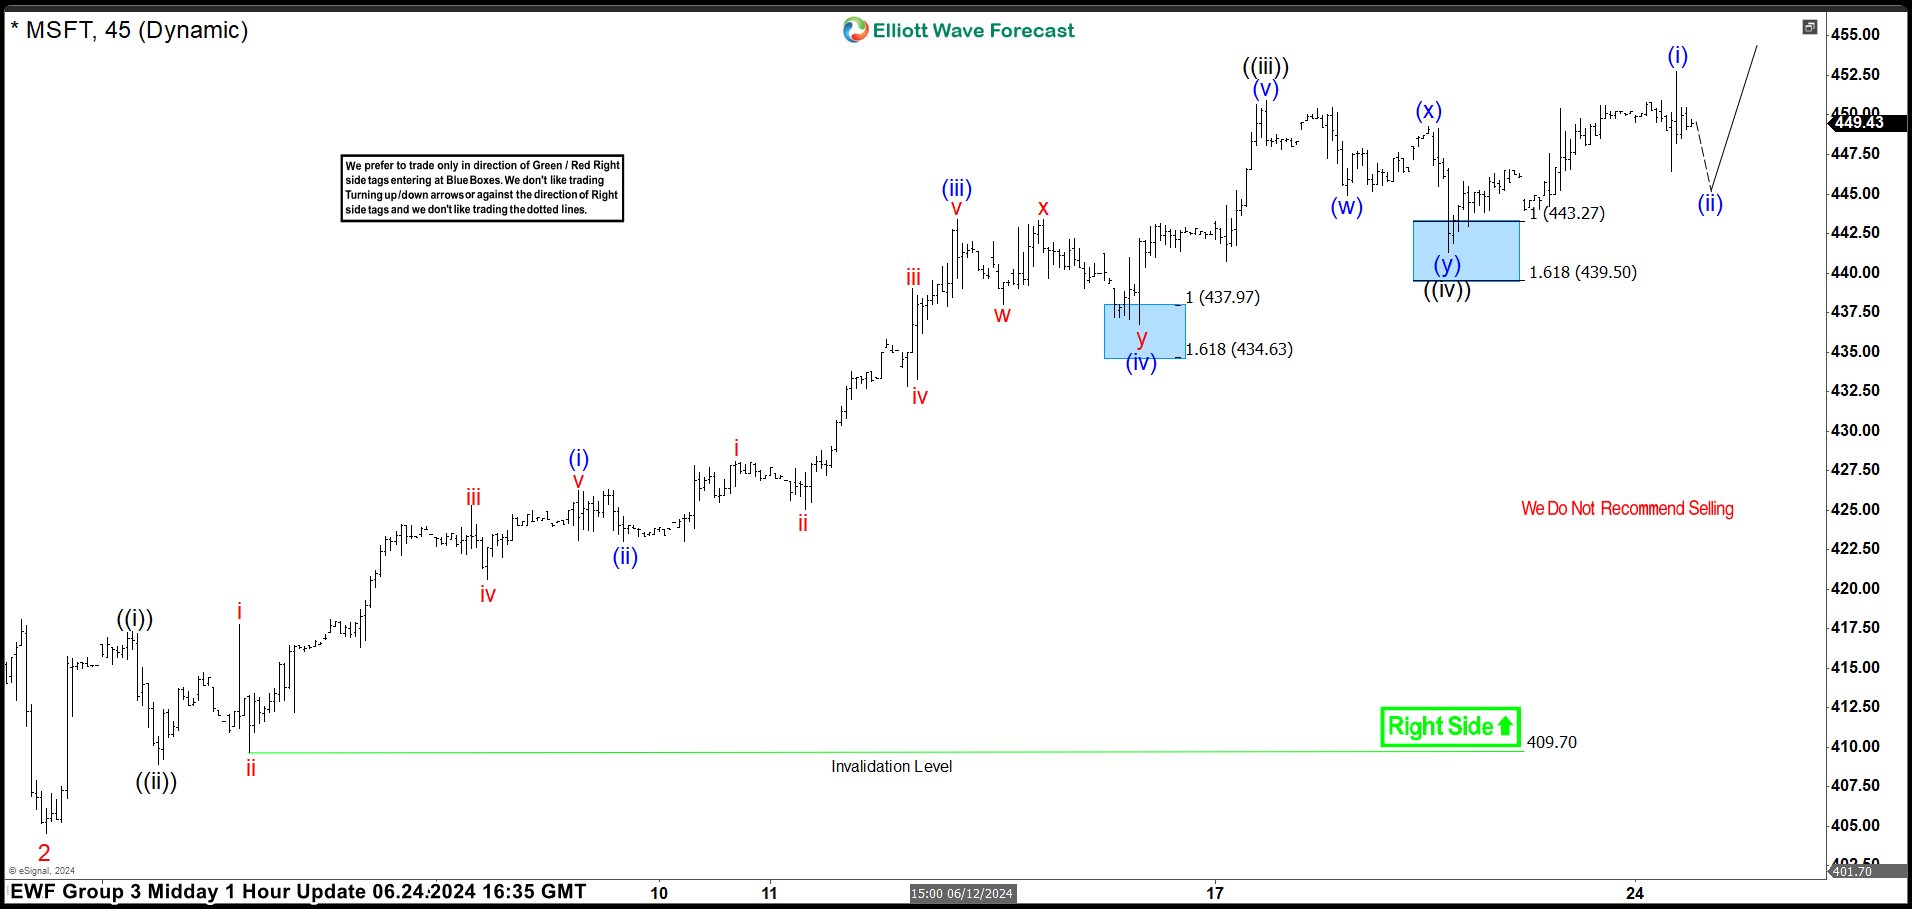
This is the latest 1-hour Elliott wave Chart from the 6/24/2024 Midday update. In which the stock is showing a reaction higher taking place, right after ending the double three correction within the blue box area. Allowed members to create a risk-free position shortly after taking the long position at the blue box area. Since then Microsoft has already made a new high above $450.94 high confirming the next extension higher.
Source: https://elliottwave-forecast.com/stock-market/microsoft-made-new-highs-blue-box-area/