
Hello everyone! In today’s article, we will look at the past performance of the 1H Hour Elliott Wave chart of Tesla Inc. ($TSLA). The rally from 6.11.2024 low at $167.40 unfolded as 5 waves impulse. So, we expected the pullback to unfold in 3 swings and find buyers again. We will explain the structure & forecast below:
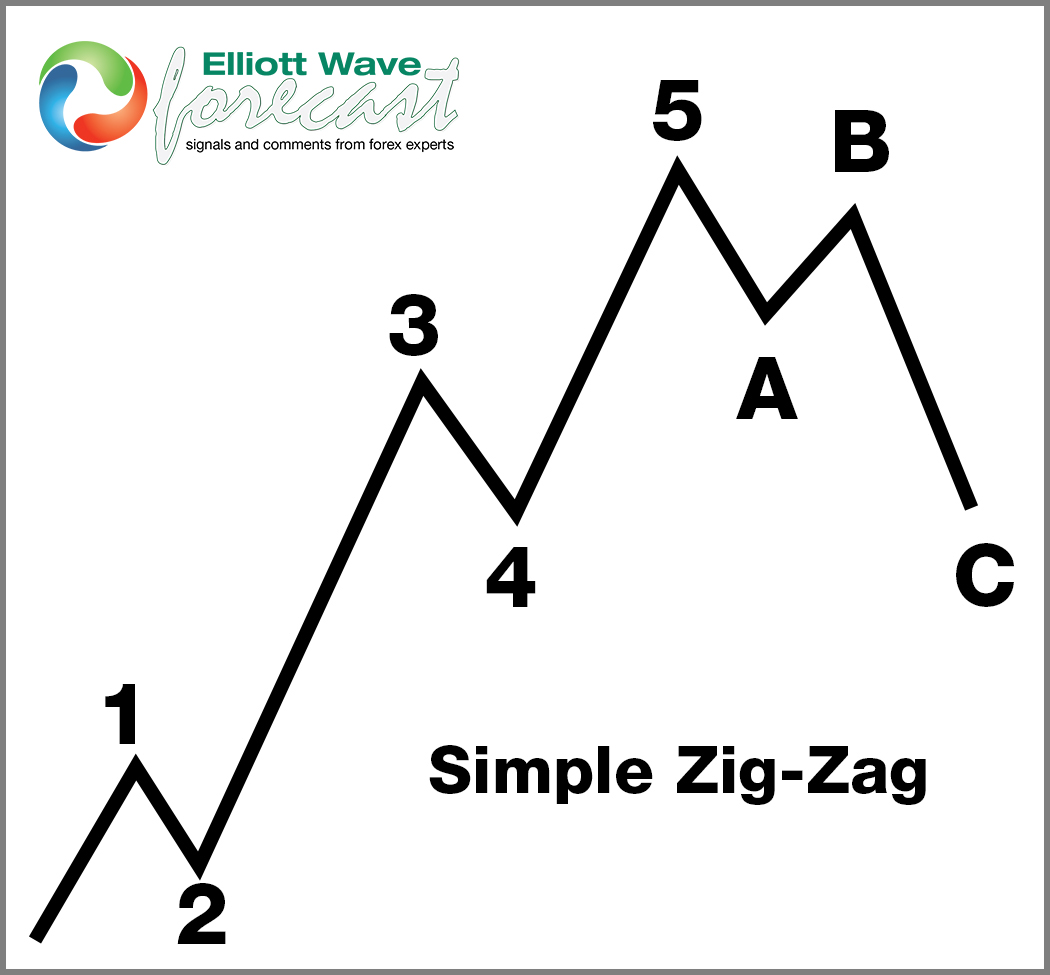
5 Wave Impulse Structure + ABC correction
$TSLA 1H Elliott Wave Chart 6.14.2024:
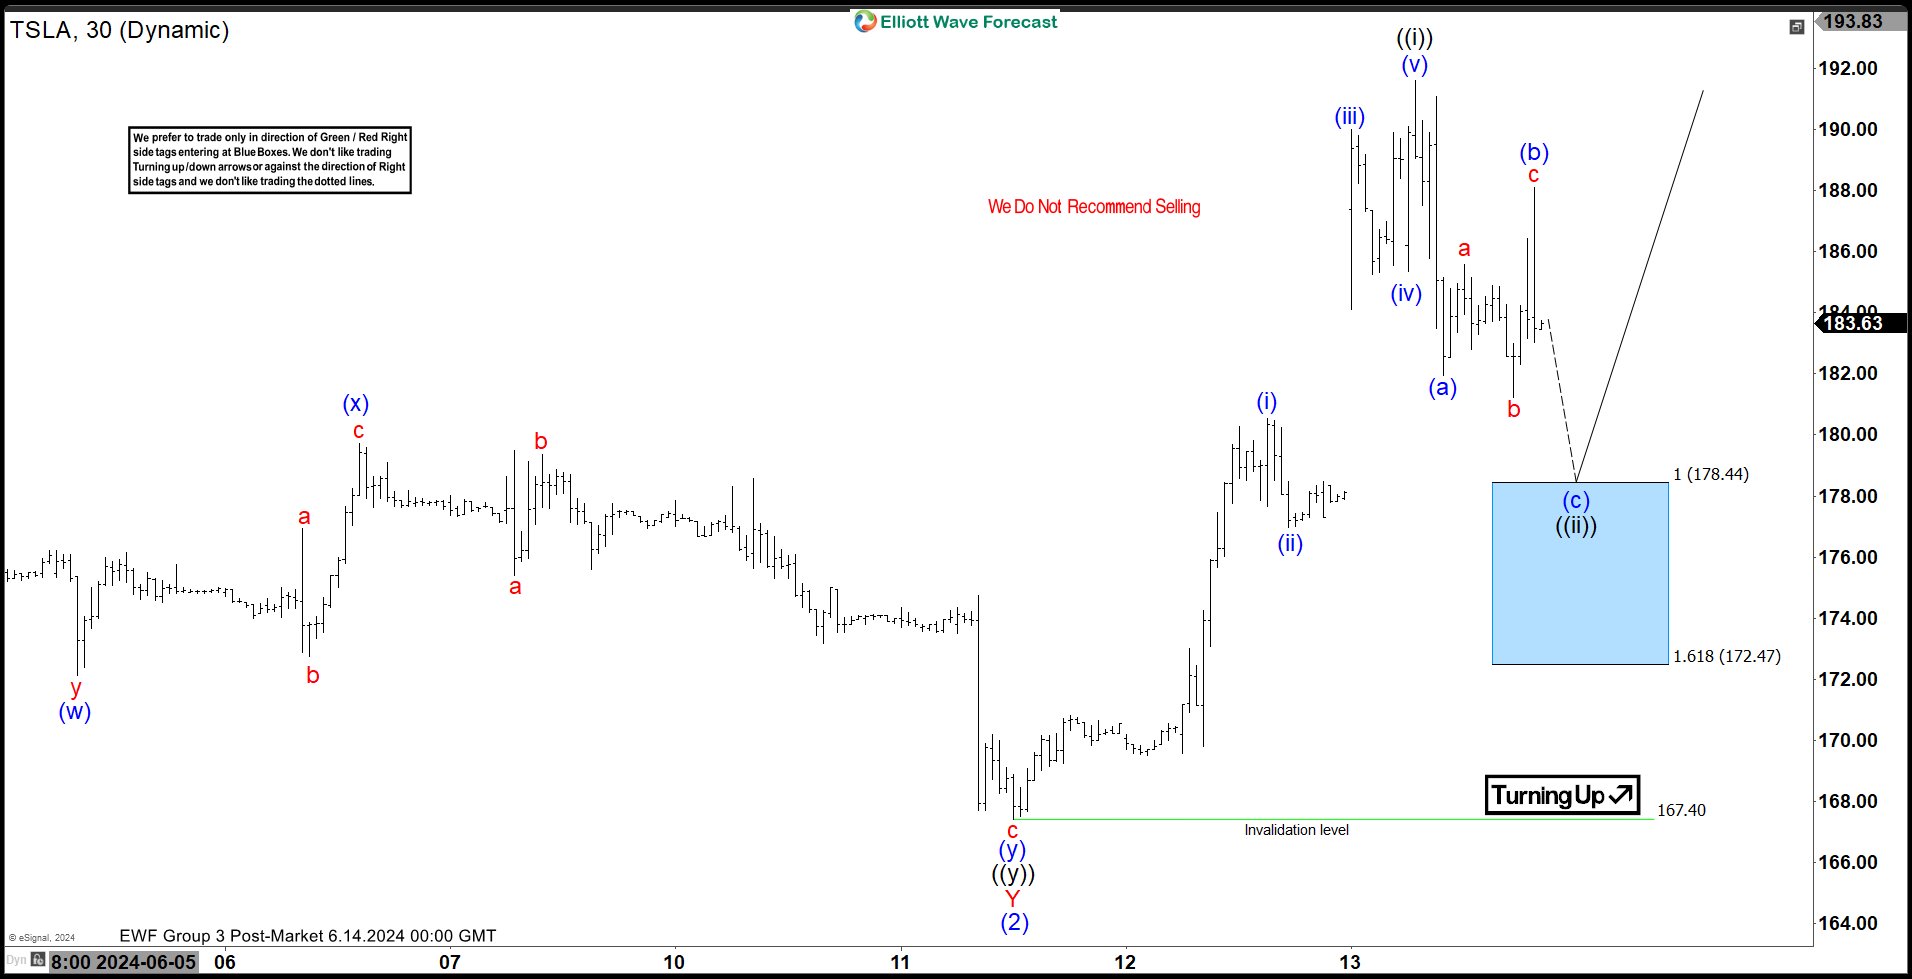
Here is the 1H Elliott Wave count from 6.14.2024. We expected the pullback to find buyers at the blue box area at 178.44 – 172.47 in 3 swings.
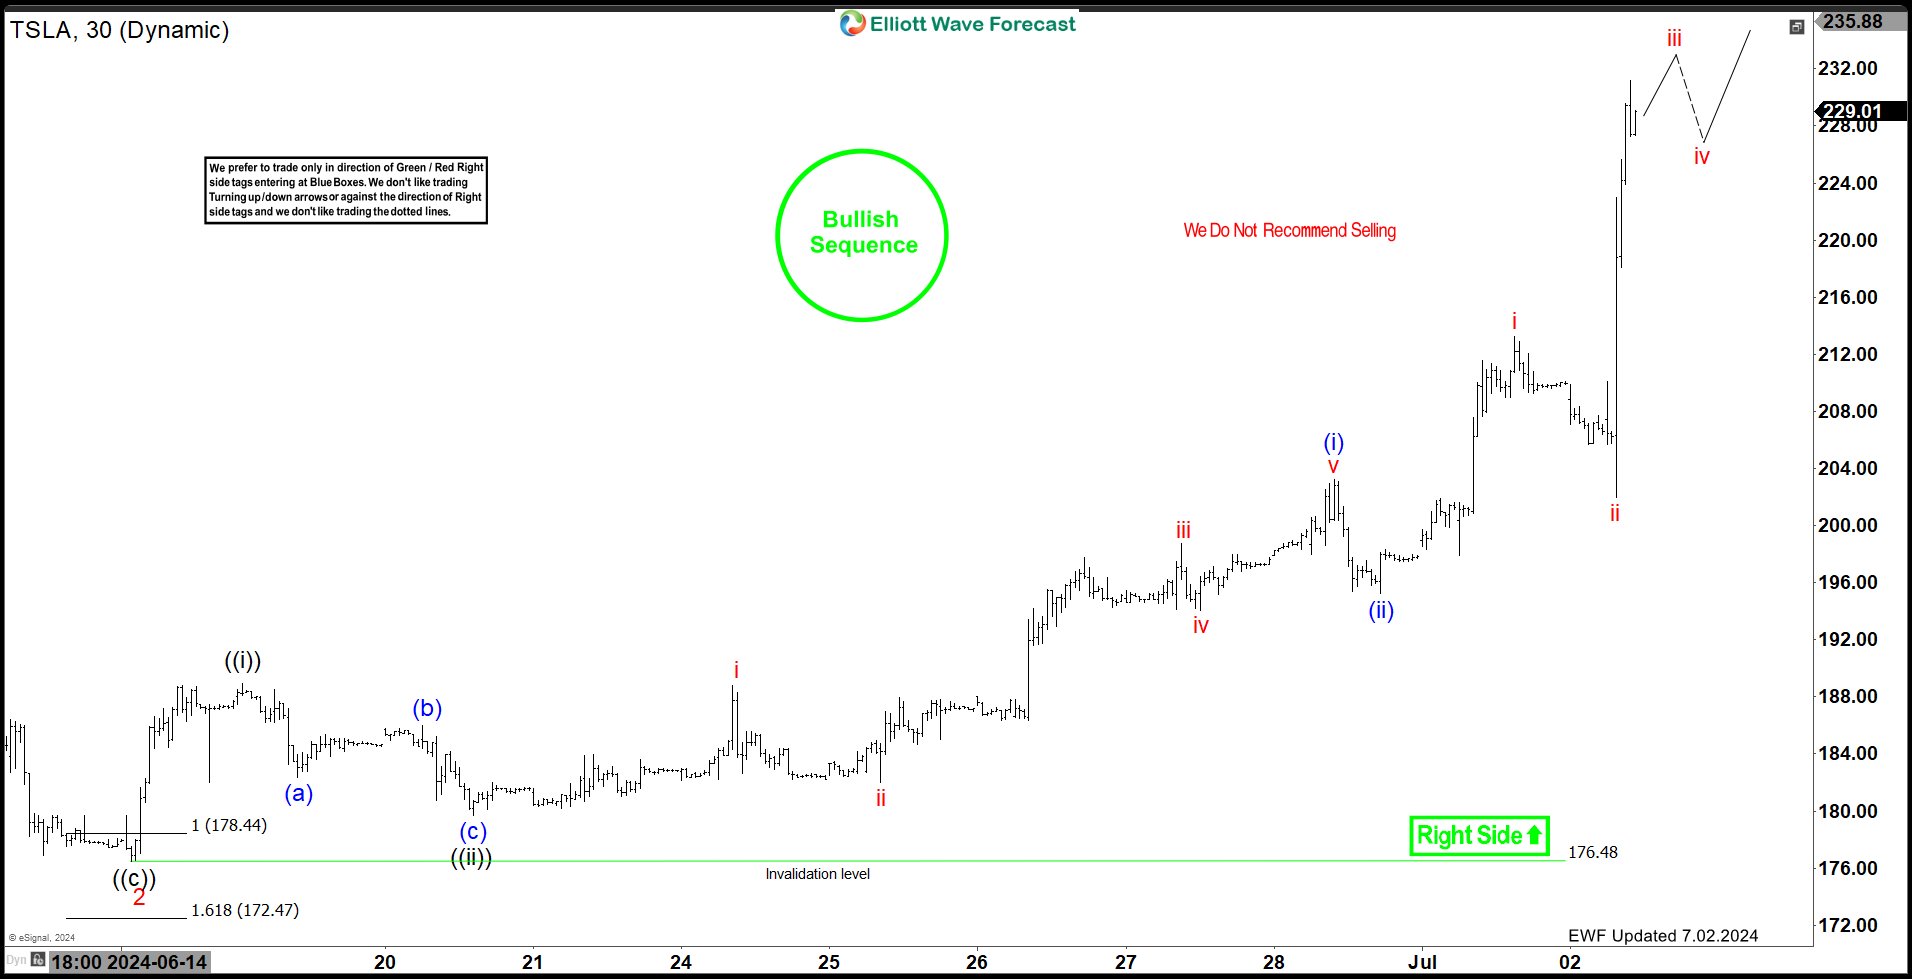
$TSLA 1H Elliott Wave Chart 7.02.2024:
Here is the latest 1H update from 7.02.2024, showing the rally taking place as expected. The stock has reacted higher from the blue box area allowing longs to get risk free. The stock has reached the first target area at $227 where traders can book profits. The next target higher is $335 area and eventually new all time highs.
Source: https://elliottwave-forecast.com/video-blog/wave-tsla-impressive-rally-next/