
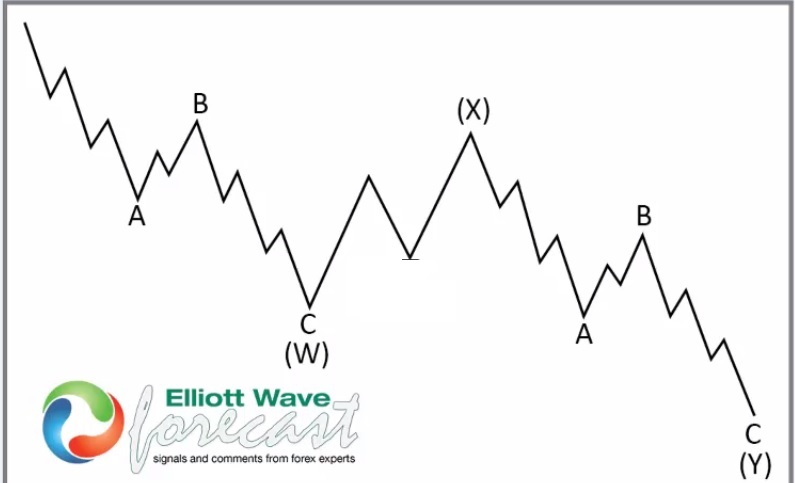
Hello everyone. In today’s article, we will look at the past performance of the 4H Hour Elliott Wave chart of Invesco Nasdaq ETF ($QQQ) . The rally from 10.23.2023 low unfolded as 5 waves impulse. So, we expected the pullback to unfold in 7 swings and find buyers again. We will explain the structure & forecast below:
7 Swings WXY correction
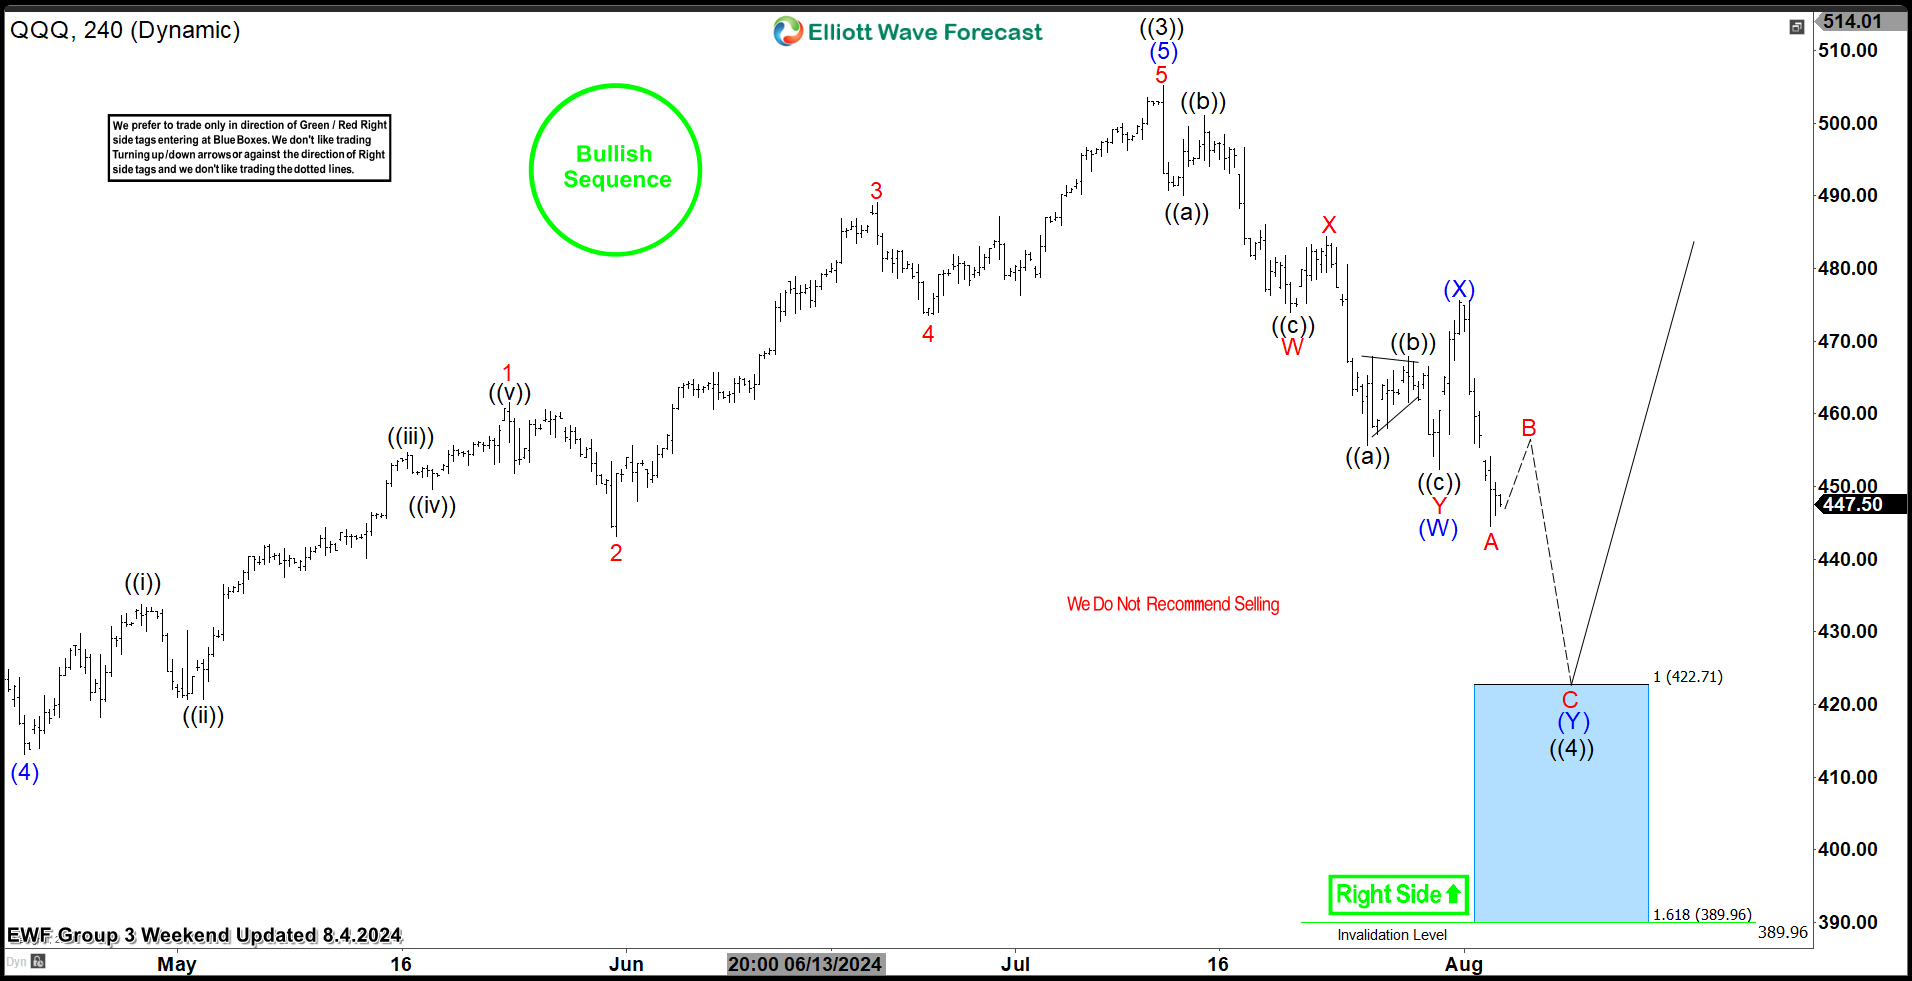
$QQQ 4H Elliott Wave Chart 8.04.2024:
Here is the 4H Elliott Wave count from 8.04.2024. The 5 wave impulsive cycle from 4.19.2024 ended on 7.10.2024 at black ((3)) and started a pullback. We expected the pullback to find buyers at the blue box area at 422.71 – 389.96 in 7 swings.
$QQQ 4H Elliott Wave Chart 8.05.2024:
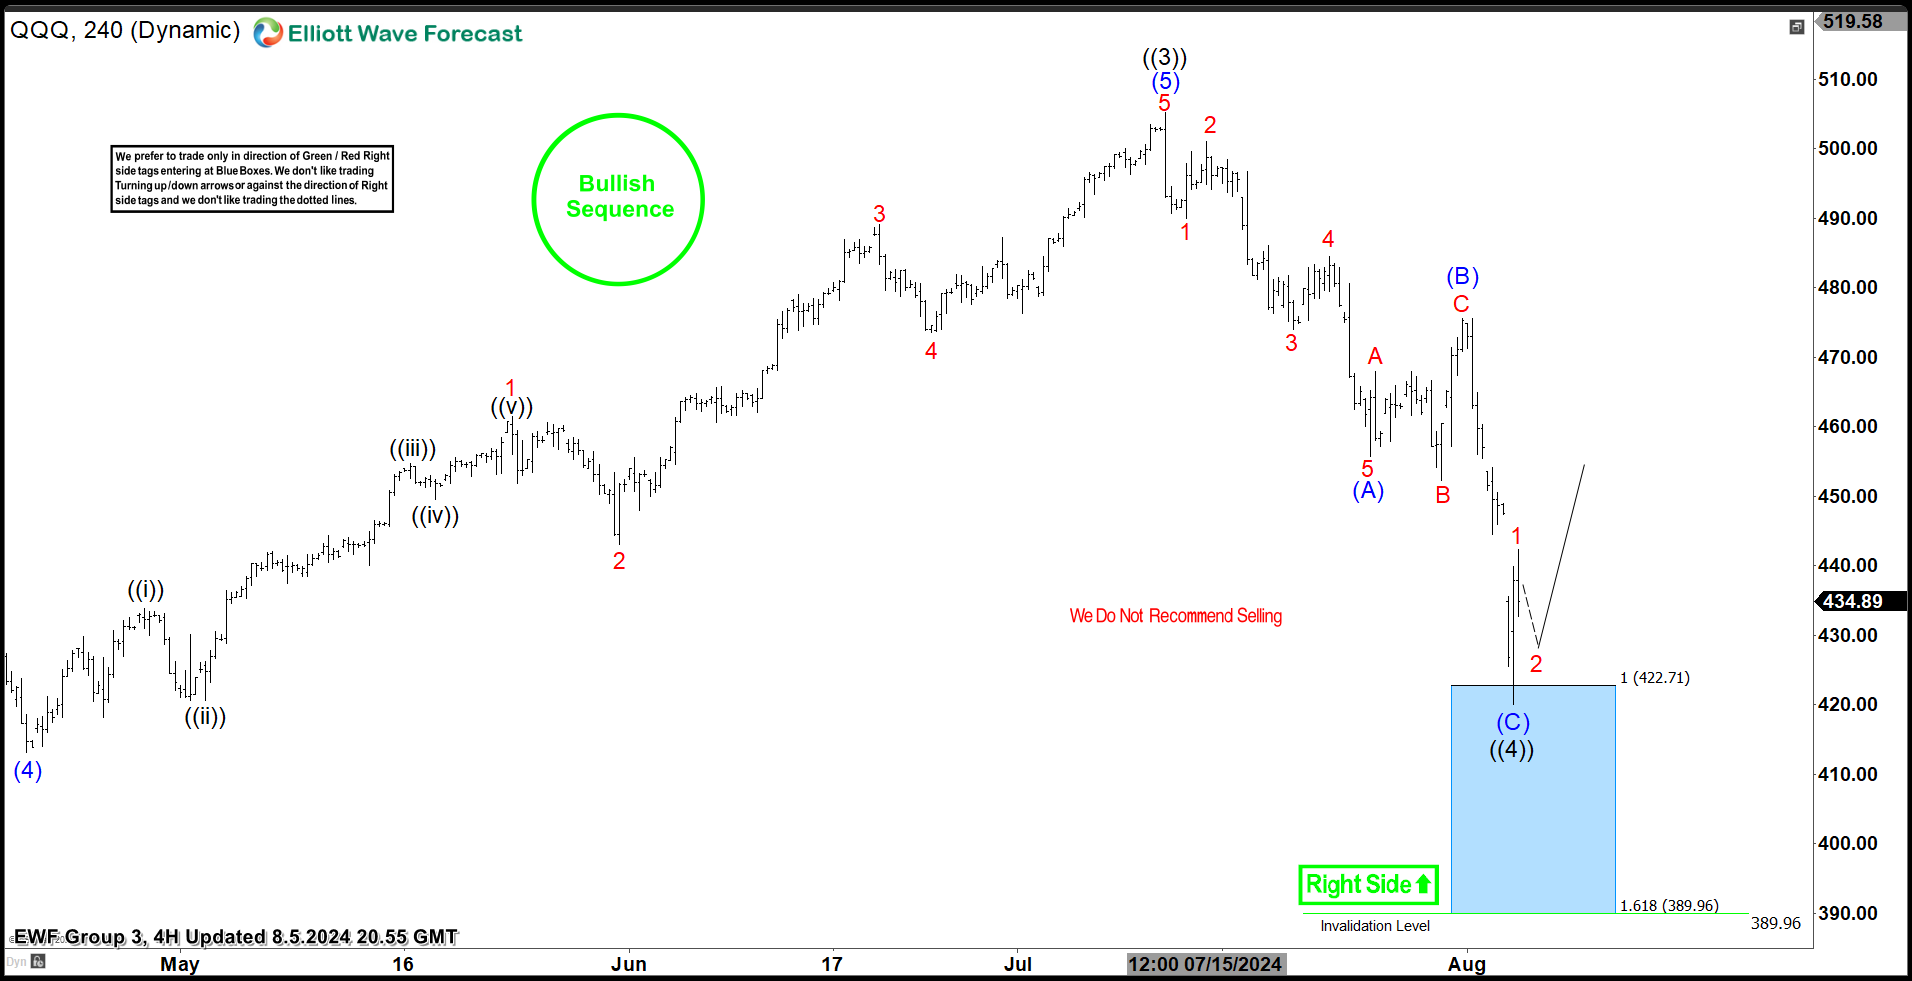
Here is the latest 4H update from 8.05.2024, showing the bounce taking place as expected. The cycle from the peak at black ((3)) has ended and the ETF has reacted higher from the blue box area allowing longs to get risk free. The ETF is expected to remain supported with a target area towards $522 – 553 area before another pullback can happen. Alternatively, the bounce can fail and continue lower in a 11 swings correction so chasing now can be risky. A break of black ((3)) high will confirm the next leg higher and negate the possibility of a double correction.