
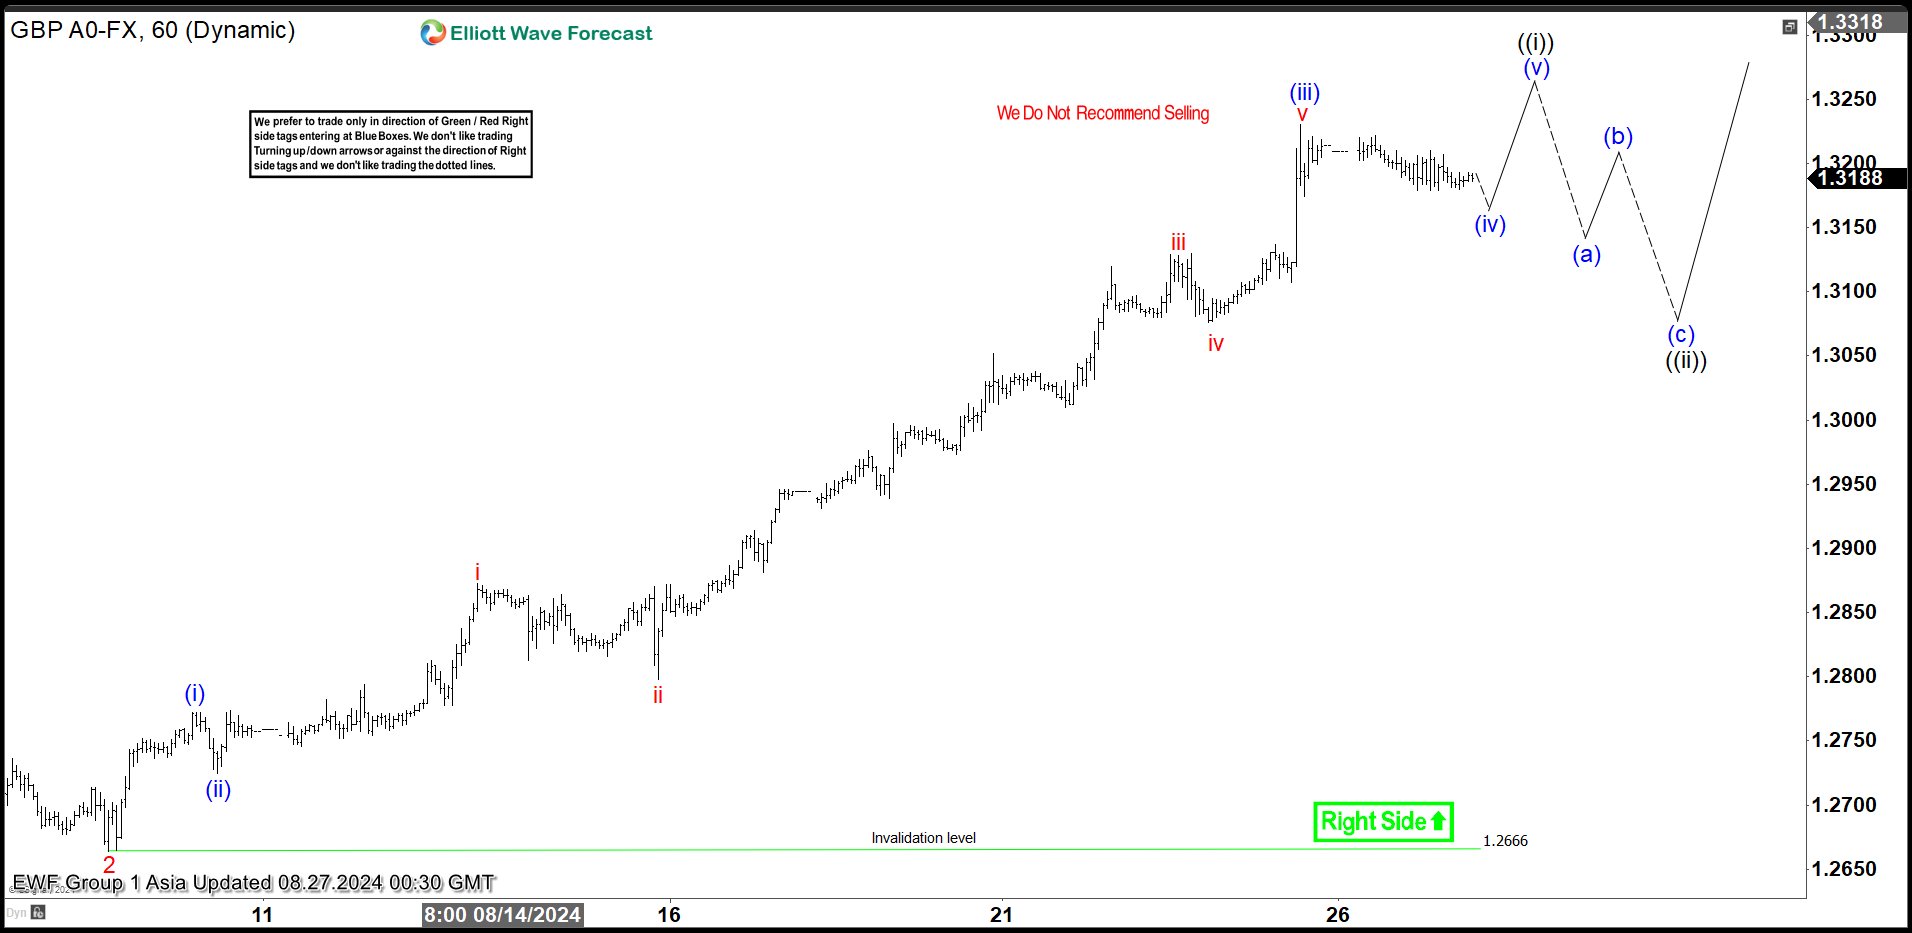
GBPUSD recently broke above previous peak on 7.14.2023 high at 1.3143 and shows a higher high bullish sequence from 9.26.2022 low. This leaves no doubt about the right side and direction of the pair which is higher. Near term, rally from 4.22.2024 low is ongoing as a 5 waves impulse Elliott Wave structure. Up from 4.22.2024 low, wave 1 ended at 1.3045 and pullback in wave 2 ended at 1.266. Pair has turned higher and broken above wave 1 suggesting wave 3 is in progress.
Up from wave 2, wave (i) ended at 1.277 and dips in wave (ii) ended at 1.272. Pair extended higher again from there. Up from wave (ii), wave i ended at 1.287 and pullback in wave ii ended at 1.2798. Pair extended higher in wave iii towards 1.313 and wave iv pullback ended at 1.307. Final leg wave v ended at 1.323 which completed wave (iii). Expect pair to end wave (iv) and rally 1 more leg to end wave (v) which should complete wave ((i)). Then it should pullback in wave ((ii)) to correct cycle from 8.8.2024 low in 3, 7, 11 swing before the rally resumes. Near term, as far as pivot at 1.266 low stays intact, expect dips to find support in 3, 7, 11 swing for further upside.
GBPUSD 60 Minutes Elliott Wave Chart
Source: https://elliottwave-forecast.com/news/elliott-wave-intraday-shows-bullish-sequence-gbpusd/