
CrowdStrike Holdings, Inc. (CRWD) is an American cybersecurity technology company based in Austin, Texas. It provides cloud workload and endpoint security, threat intelligence, and cyberattack response services.
CrowdStrike (CRWD) July 2021 Daily Chart
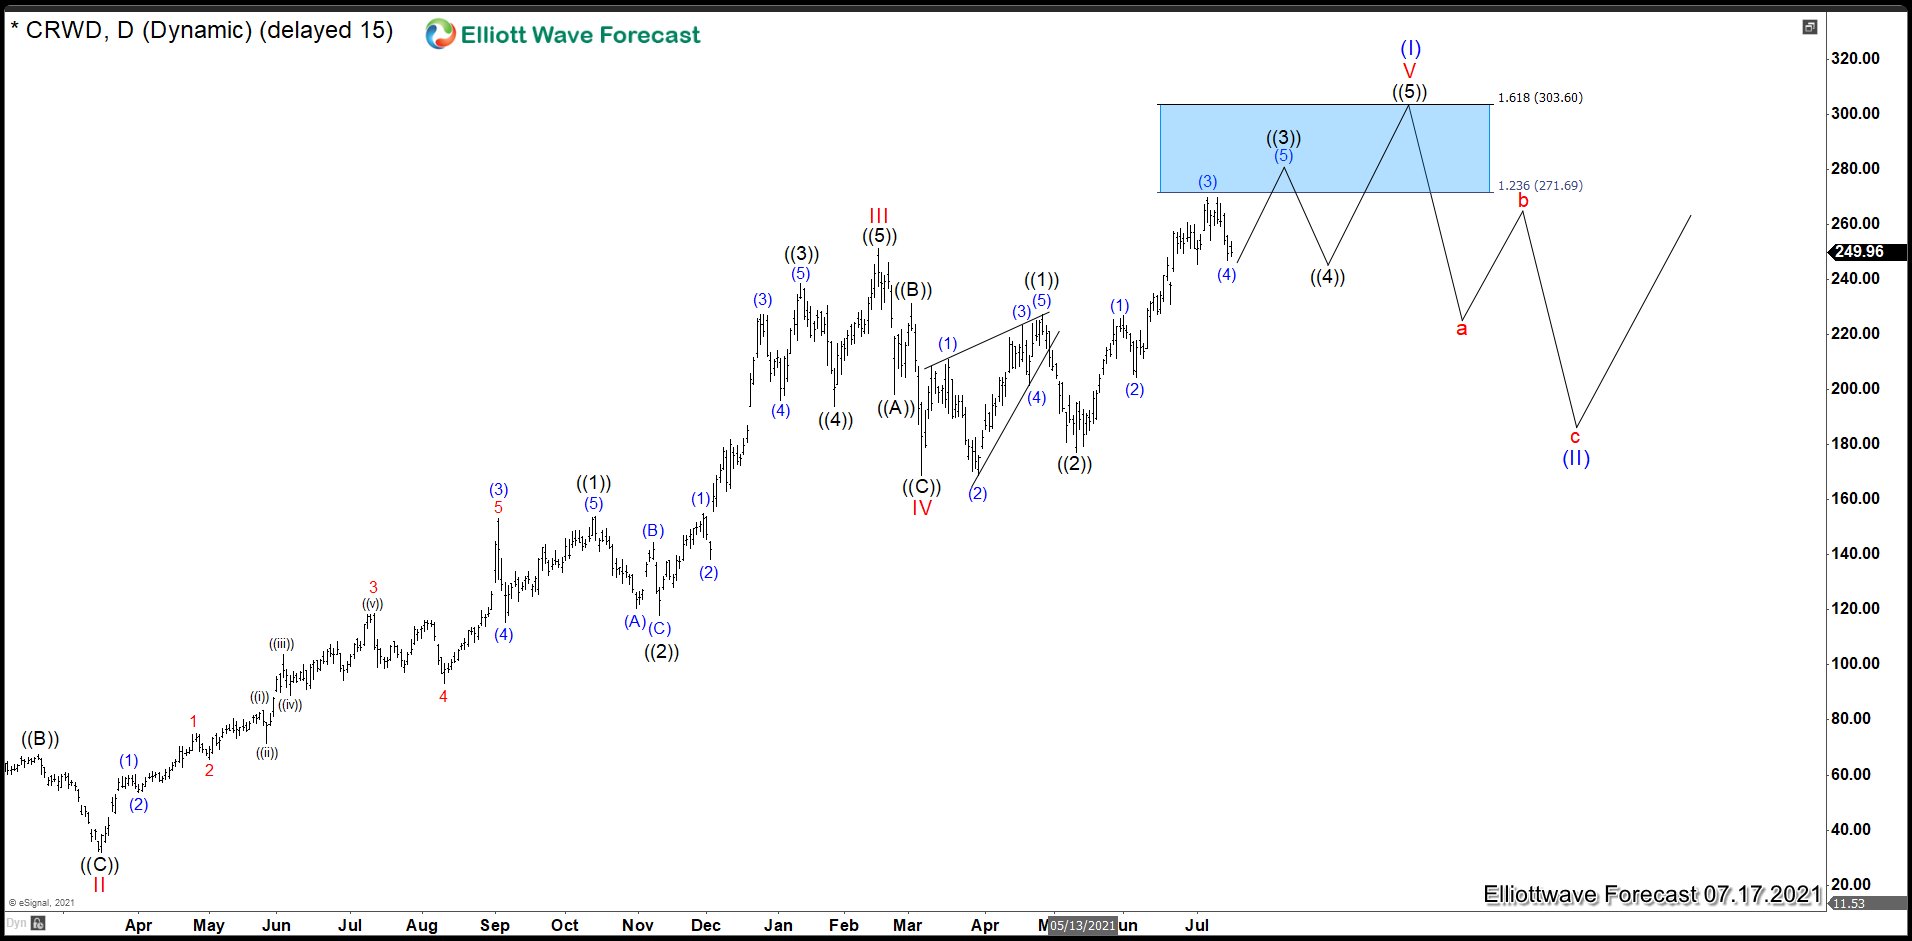
The chart above shows the daily view that we forecast 3 years ago. We were expecting to end an very important market cycle in the blue box area between 303.60 – 271.69. This cycle would end an impulse on CRWD since it listed on the stock exchange. Once the impulse would end as wave (I), we expected a big correction as wave (II).
CrowdStrike (CRWD) February 2022 Daily Chart
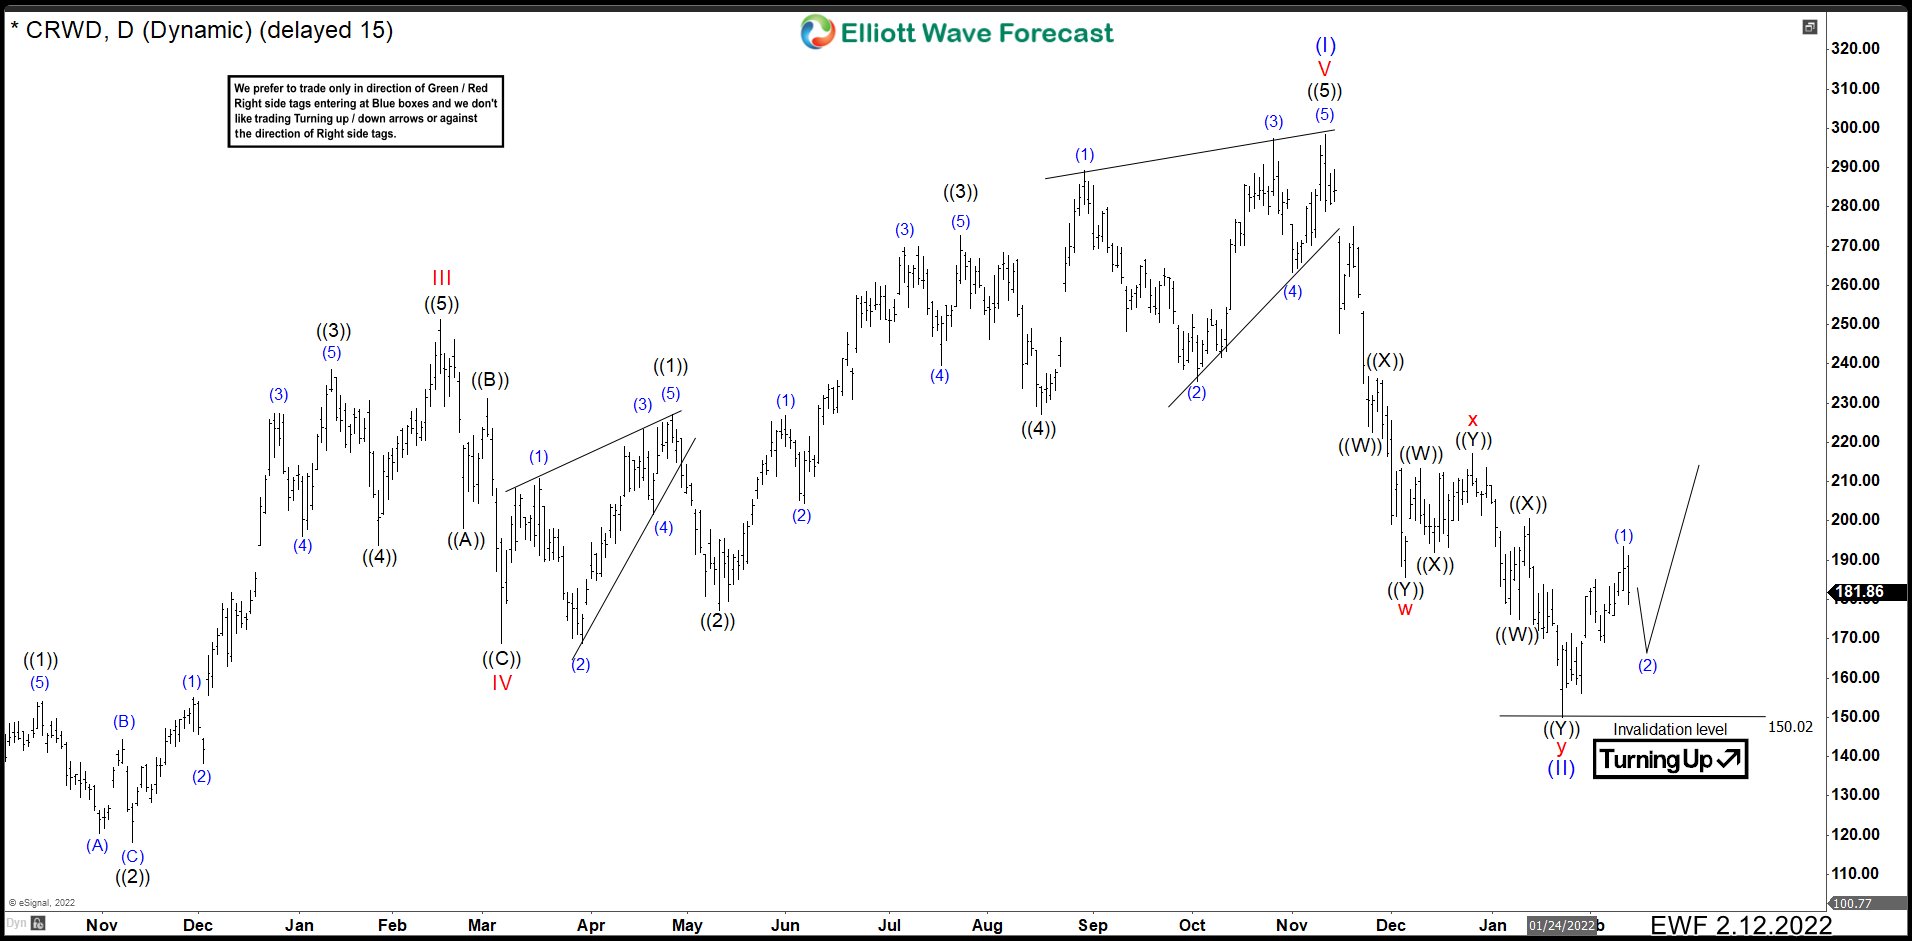
Six months later, We can see the wave (I) ended in the proposed blue box area at 298.48 high developing an ending diagonal. The market reacted perfectly to the downside and we called completed a double correction as wave (II) at 150.02 low. Exactly at the 50% Fibonacci retracement, the stock bounce suggesting the pullback was over and the rally should continue to break 298.48 high in a new cycle.
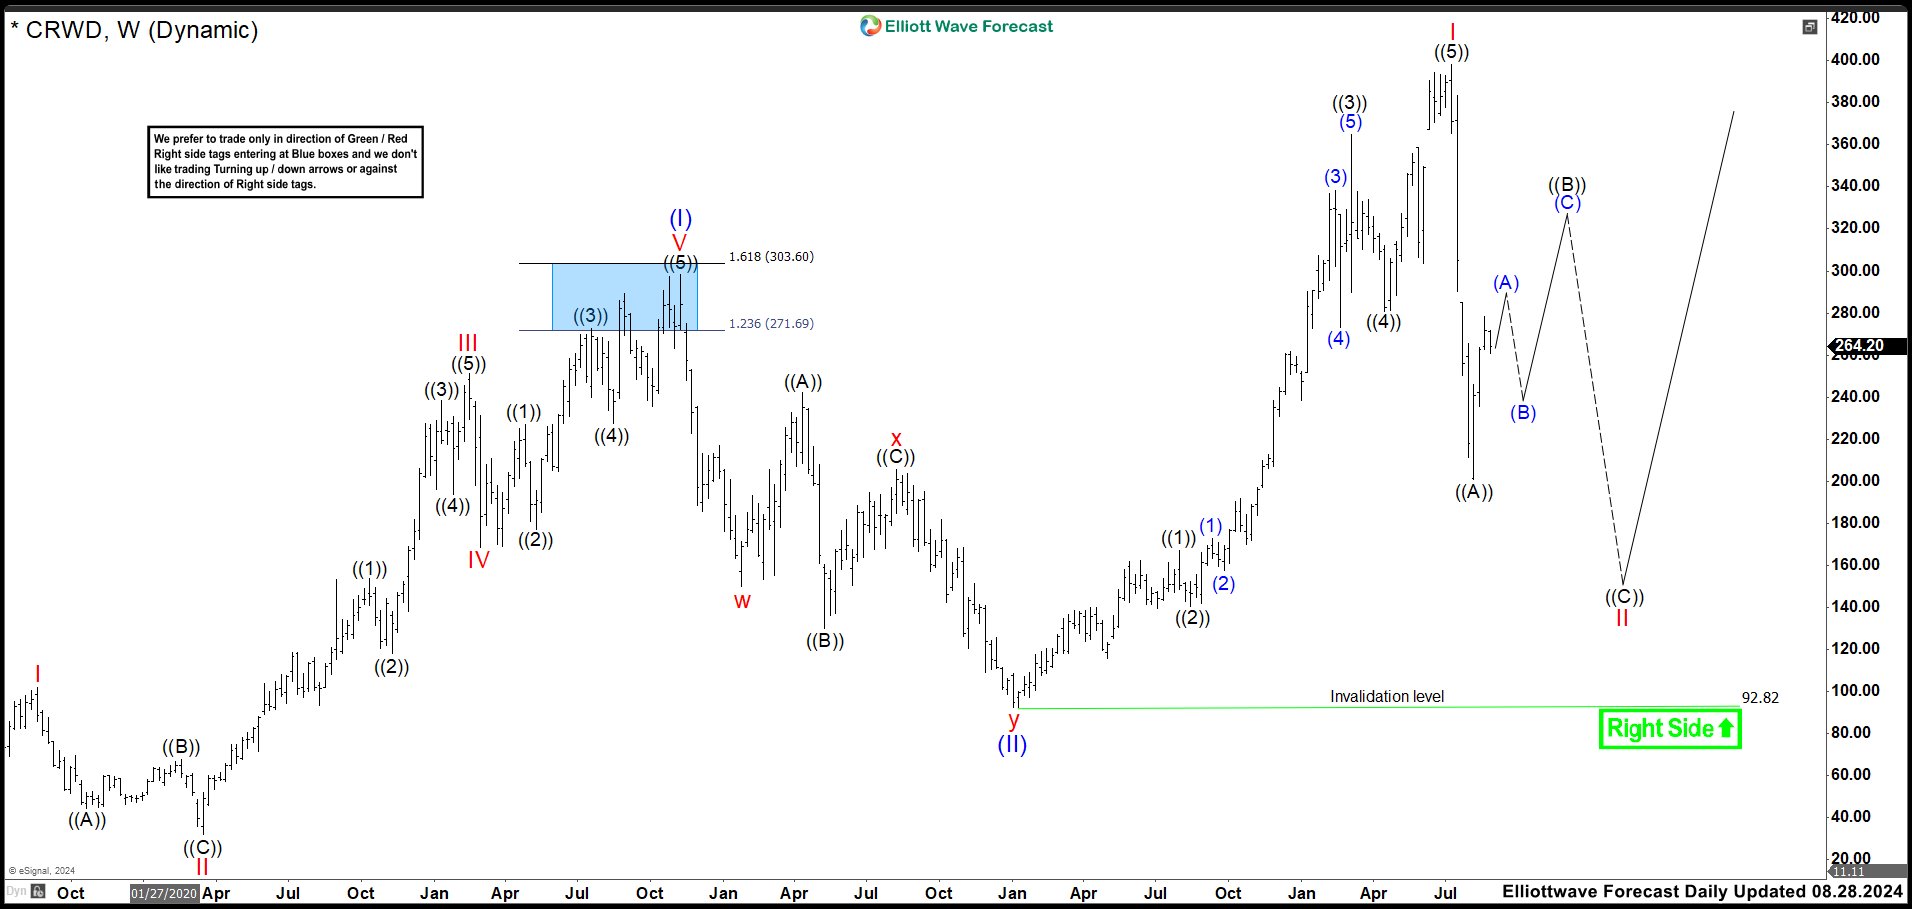
CrowdStrike (CRWD) August 2024 Daily Chart
After 3 years, we have above the current weekly chart. We can see the cycle we called completed the wave (II) at 150.02, it just was part of a bigger double correction. Therefore, the cycle that ended at 150.02 was wave “w”, then we have expanded flat correction as wave “x” ending at 205.73. Last push lower finished wave “y” at 92.25 low completing wave (II) pullback. The rally we thought went to start in Jan 2022, started at Jan 2023.
Source: https://elliottwave-forecast.com/stock-market/crowdstrike-crwd-bull-trap-ahead/