Analog Devices, Inc. ADI is a global leader in designing and manufacturing integrated circuits and analog, mixed-signal, and digital signal processing (DSP). Founded in 1965, the company specializes in converting real-world phenomena like sound, light, and temperature into digital data, which is crucial for various applications in industries such as automotive, healthcare, industrial automation, and communications.
Analog Devices went public in 1969 and trades on the NASDAQ under the ticker symbol $ADI. The company has a strong reputation for innovation and has consistently performed well financially, benefiting from the growing demand for advanced electronics and the expansion of connected devices across multiple industries.
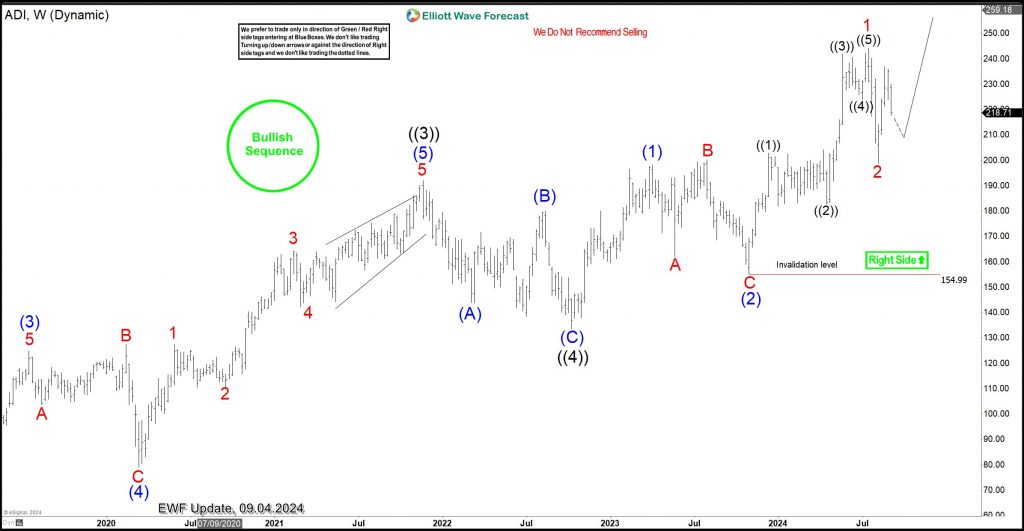
ADI Elliott Wave Analysis, Weekly Chart 09.04.2024
The right side is bullish against the all-time low. From the all-time low, the impulse sequence is advancing upwards for the Grand Super Cycle degree wave ((I)). Waves (I) and (II) of ((I)) were completed in August 2000 and December 2008, respectively. The bullish impulse sequence of Wave I of (III) has emerged from the December 2008 low. All of this can be observed on the monthly chart.
On the daily chart, the stock completed wave ((4)) of I in October 2022 and then rallied above the wave ((3)) high, confirming the progress of wave ((5)) of I. After completing waves (1) and (2) of ((5)), wave (3) is currently emerging from the October 2023 low of 154.99. In the minor degree, the price has completed waves 1 and 2 of (3) and is now in wave 3 of (5). A break above the top of wave 1 would confirm wave 3 if the current dip holds above 153.99. Therefore, the right trade plan is to wait for pullbacks in 3, 7, or 11 swings to buy from. At Elliottwave-Forecast, we provide the blue box on our chart where traders can find LONG and SHORT entries. The H4 chart below shows one such blue box on ADI as of August 5th, 2024.
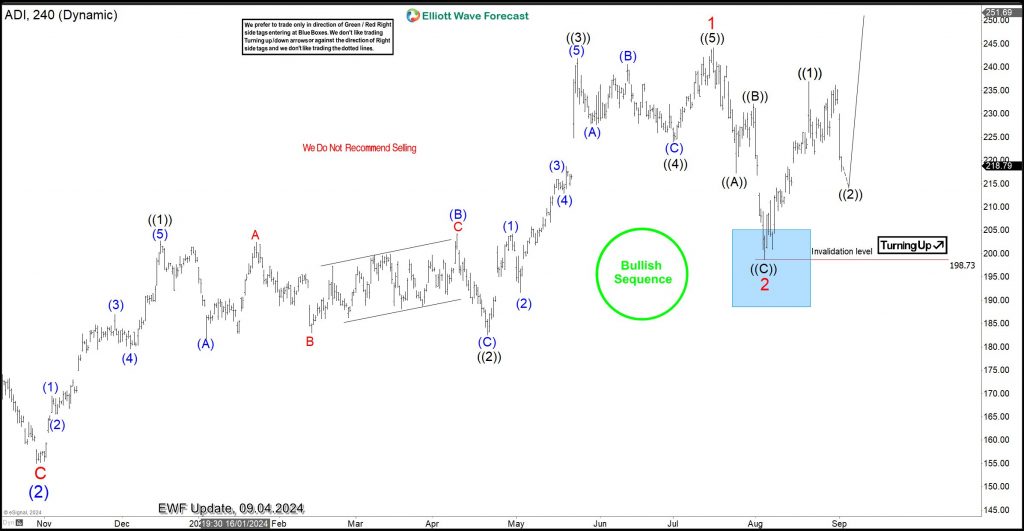
ADI Elliott Wave Analysis, 4-Hour Chart 09.04.2024
The H4 chart shows the blue box marking the end of wave 2 of (3). The pullback completed a zigzag, forming a 3-swing structure. Additionally, the blue box captured the extreme where buyers found an entry at the top of the box, with a stop loss placed a few points below the blue box. Wave 2 found support in the blue box as expected and rallied to a safe area. At the safe area, members can close half of the position in profit and adjust the rest to breakeven. This way, no matter what happens next, it’s already a winning trade.
WHAT NEXT?
1. The price completes wave ((2)) above 198.73 and rallies to break above the wave 1 high with wave ((3)). If this occurs, we will hold the current half position and add another long position at the blue box of the next pullback. The next pullback to buy could be wave (2) of ((3)), wave (4) of ((3)), or wave ((4)).
2. The price drops below 198.73. If this happens, the half position at breakeven will close. Afterward, wave 2 may extend lower, offering buyers an opportunity to buy from the next blue box.
Source: https://elliottwave-forecast.com/stock-market/adi-found-buyers-blue-box/


