
MicroStrategy (NASDAQ: MSTR) is currently still one of the best performing stocks of 2024. In our previous article, we explained the bullish nature of the impulsive structure taking place and what we expect next. In this article, we’ll take a look at the current correction and highlight the potential buying area.
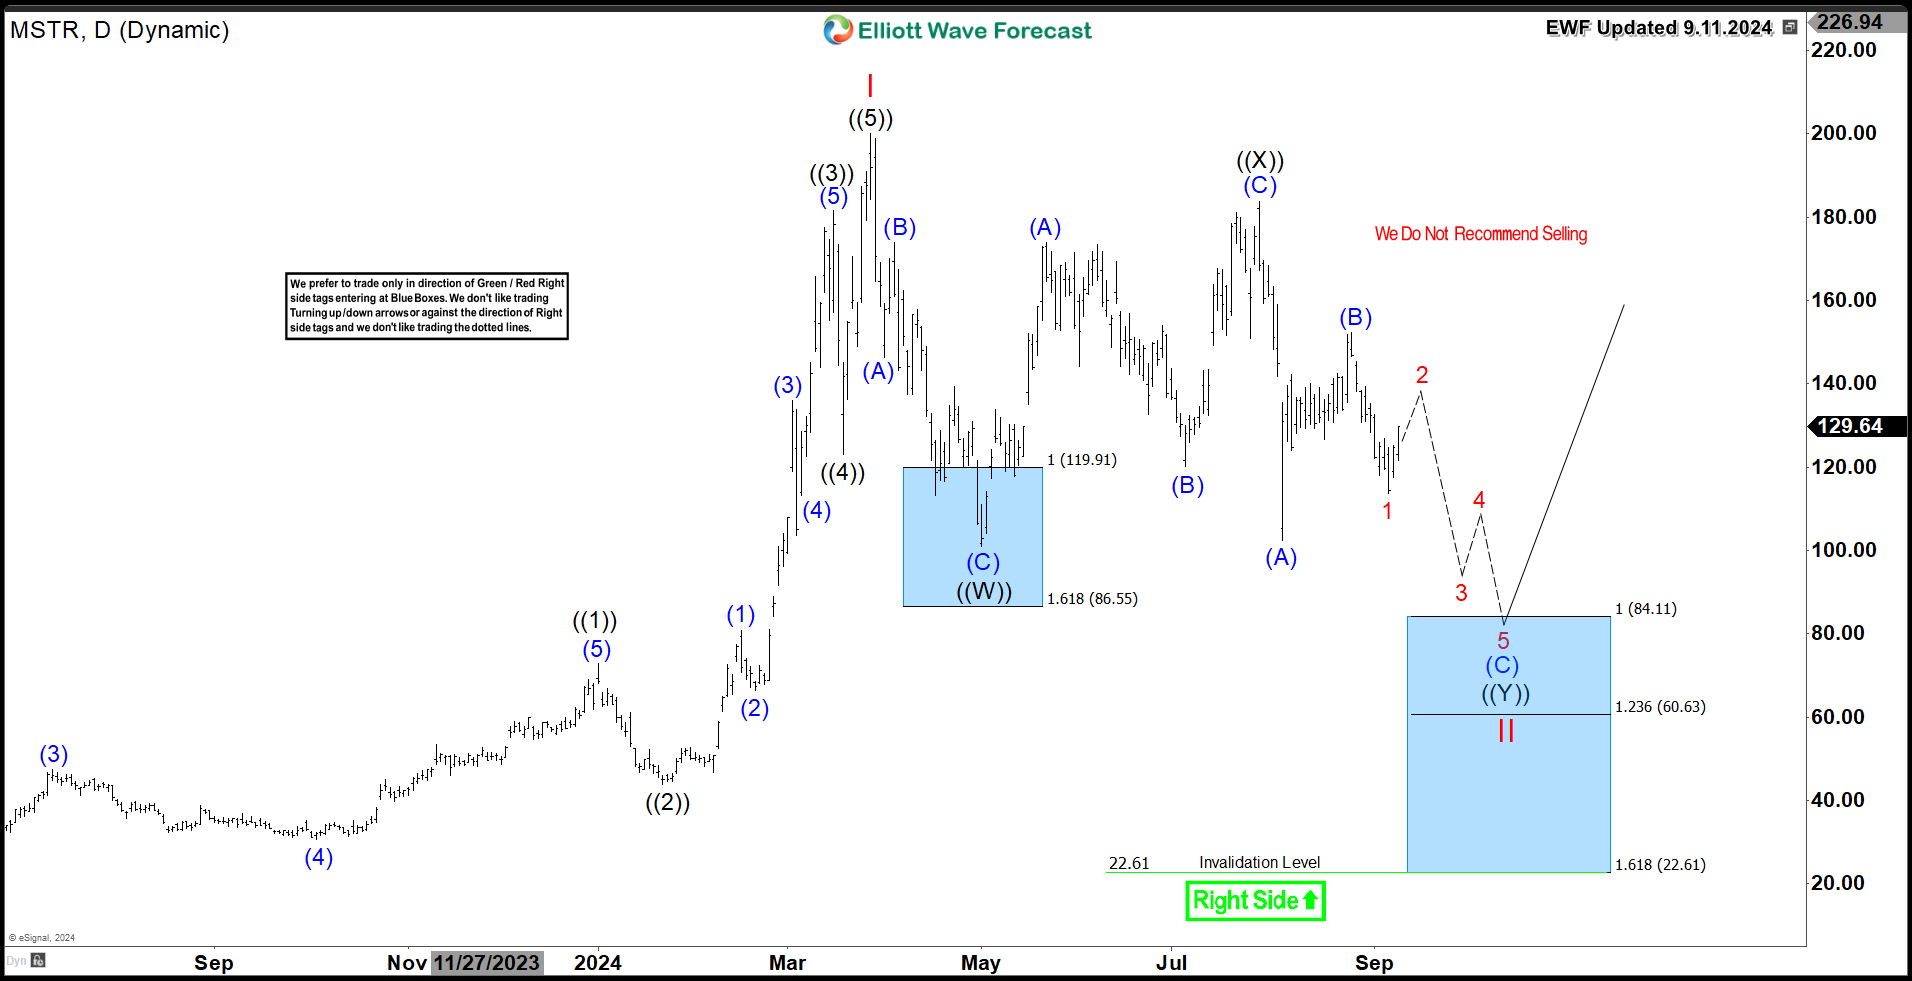
MSTR ended the impulsive 5 waves advance at $200 , the highest level seen in 24 years. The peak in March 2024 marked wave I then the stock started it’s correction lower in wave II. MSTR did a 3 waves ZigZag structure into our blue box area $119 – $86. From there the stock reacted higher within another 3 waves without breaking the previous peak. Since then, the stock sow another sharp decline in August without breaking May low $101. It’s currently sitting within a sideways range for the recent 5 months and we can identify the next potential extreme area if price drops into new lows.
If MSTR breaks 8/5/2024 low $102.4, then it will confirm the double three corrective structure ((W))((X))((Y)). This move indicates another decline to take place toward the blue box area at equal legs $84 – $60. That high frequency area should present a buying opportunity for investor as price is expected to turn higher from there. MSTR will either resume the bullish trend into wave III or it will bounce at least within a 3 waves structure from there.
In Conclusion, MSTR remains bullish and the daily correction should present another investment opportunity. We don’t recommend selling the stock and we only look to buy it if it manage to reach our mentioned bleu box area.
MicroStrategy (NASDAQ: MSTR) Daily Chart 9.11.2024
Source: https://elliottwave-forecast.com/stock-market/microstrategy-mstr-buying-area/