
Gold-to-Silver Ratio has always been a useful tool to forecast the direction the underlying metals (i.e. Gold and Silver). We can calculate the ratio simply as Gold price divided by Silver price. The average gold-silver ratio was 47:1 in the 20th century. In the 21st century, the ratio has ranged mainly between 50:1 and 70:1. It broke above that point in 2018 with a peak of 104.98:1 in 2020 during the Covid 19. The lowest level for the ratio was 35:1 in 2011. The long-run average gold/silver ratio is around 65:1 since the 1970s when the gold standard was abandoned. Historically, the ratio hovered more around 15:1. The current ratio is above 80, which is at the higher end side.
When the ratio is going higher, it is often an indicator of the underlying price of Gold and Silver going down. On the contrary, when the ratio is going lower, then the price of gold and silver is going higher. In the chart below, we try to see the long term outlook of this ratio in years ahead.
Gold-to-Silver (AUG) Daily Elliott Wave Chart
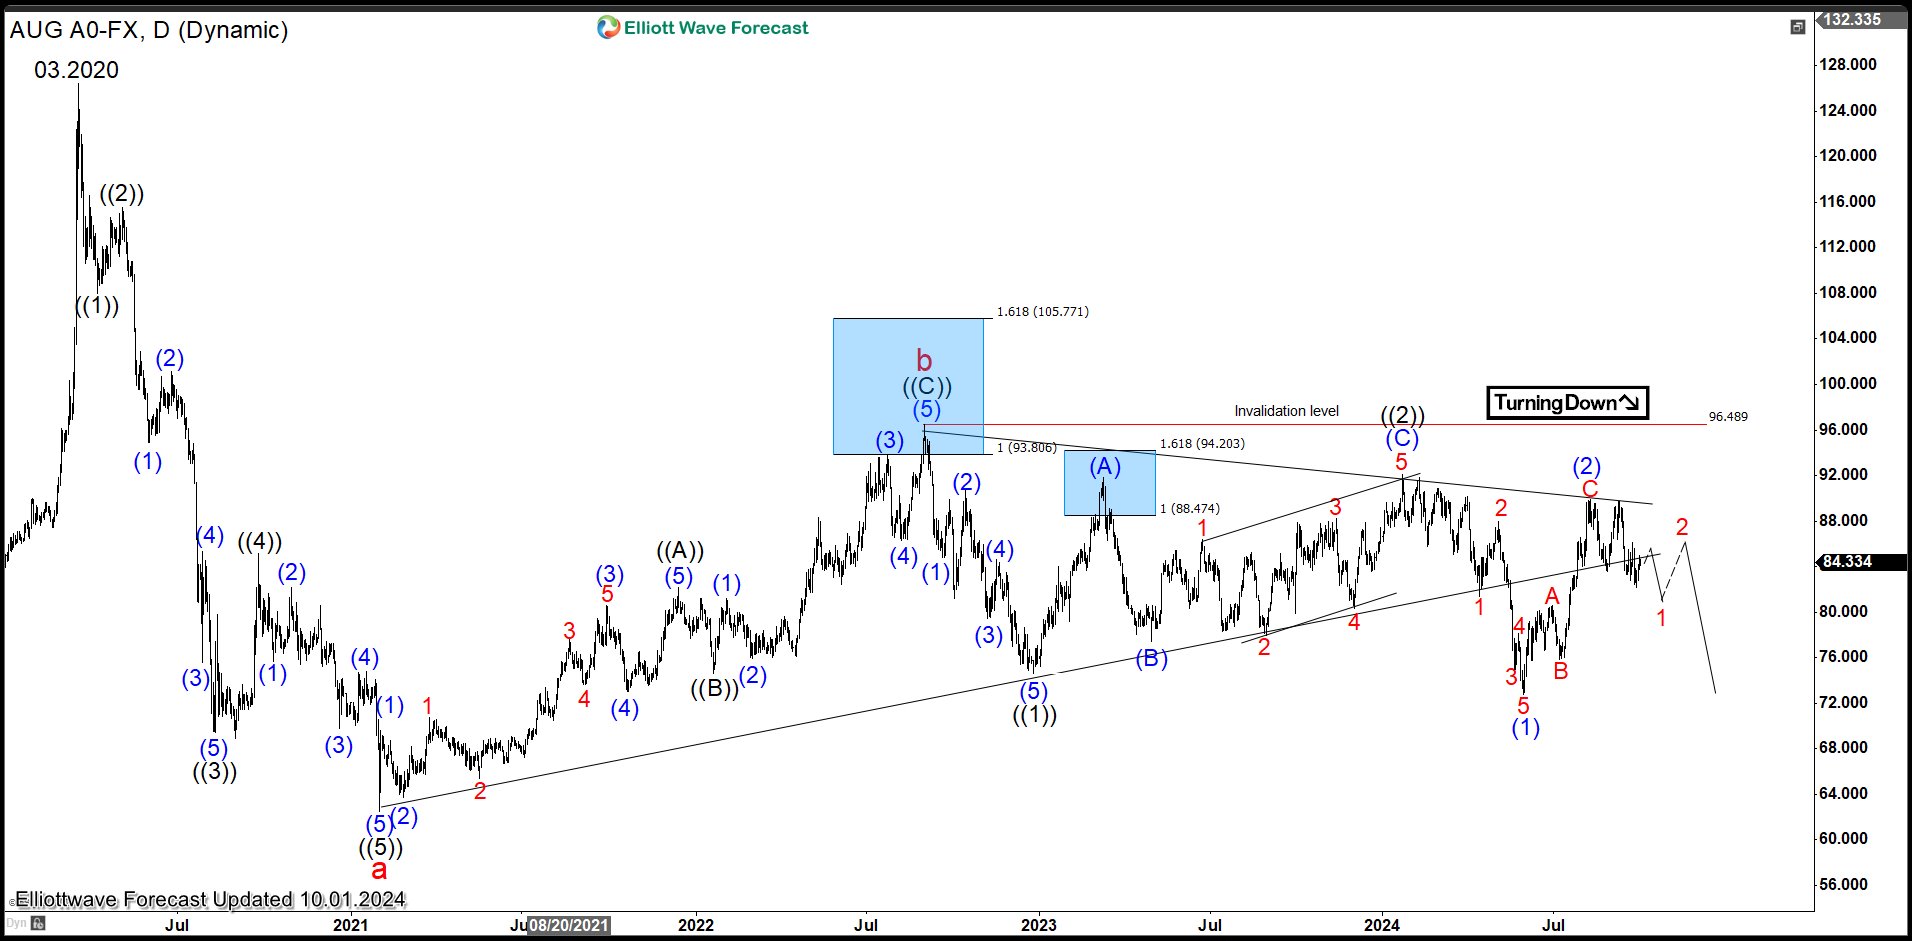
Daily Elliott Wave Chart of Gold-to-Silver ratio above shows that the ratio has been trading sideways in a triangle since 2021. The March 2020 high was a Covid-19 spike move which formed major high, just like it formed major low in Indices around the world. The ratio then turned lower as a 5 waves impulse which ended wave a at 62.51. It then corrected in a 3 waves zigzag ending wave b at 96.58.
The ratio turned lower but it has not yet broken below wave a. It still needs to break below wave a to confirm the next long term direction. We can also see the ratio breaks lower from the triangle earlier this year but it has rallied inside the triangle again before getting rejected. At this stage, we can still consider the ratio to be sideways. Short term, if the ratio breaks below wave (1), it should confirm to favor the bearish side.
Source: https://elliottwave-forecast.com/video-blog/gold-silver-ratio-aug-still-waiting-next-direction/