
Hello everyone! In today’s article, we will follow up on the past performance of the SPDR Utilities Select Sector ETF ($XLU) forecast. We will also review the latest weekly count. First, let’s take a look at how we analyzed it back in October 2023.
$XLU Weekly Elliott Wave View – October 2023:
’s Impressive Rally and What’s Coming Next")
In October 2023, we explained that $XLU had reached the Blue Box area at $55.81 – $44.73. A bounce was anticipated at this level. This area was a critical support zone identified by our Elliott Wave analysis.
$XLU Weekly Elliott Wave View – May 28, 2024:
’s Impressive Rally and What’s Coming Next")
In May 2023, we explained that $XLU has bounced from the Blue Box area. As a result, the ETF has moved higher, allowing long positions to become risk-free. We expect $XLU to continue its rally towards the $74.00 – $79.00 range in a 5-wave pattern. This rally is favored to happen before another pullback occurs. Traders should look for re-entry opportunities at black ((2)) in 3 or 7 swings. Moreover, a break above the all-time highs (ATHs) will start a bullish sequence towards the $89 – $111 range.
$XLU Weekly Elliott Wave View – Oct 07, 2024:
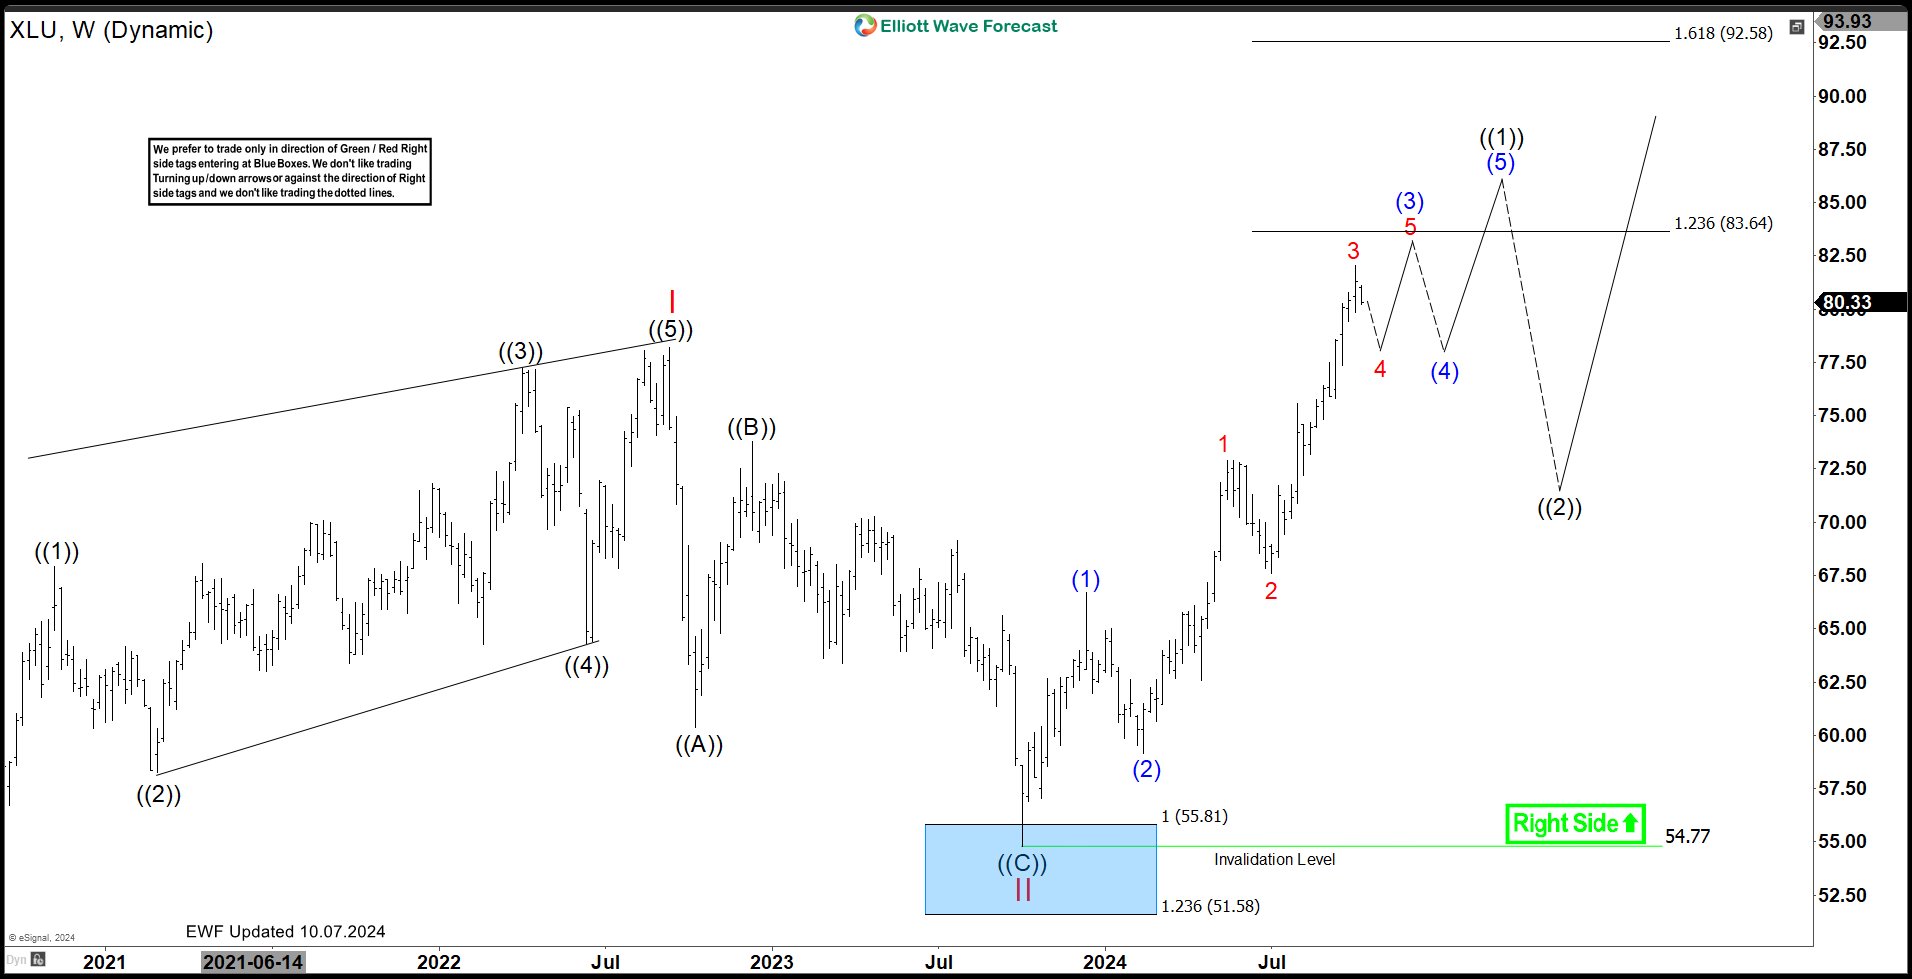
The latest weekly update is showing that the ETF has broke above the all-time highs. As a result, it has opened a bullish sequence. We expect The ETF to continue its rally towards the $83.64 – $92.58 range in a series of wave 4 and 5 pattern. Traders can look for re-entry opportunities at red 4 and blue (4) in 3 or 7 swings. Once the pattern is complete, a larger degree pullback in black ((2)) is expected to take place to correct the entire cycle from Oct 2023 low.
Source: https://elliottwave-forecast.com/stock-market/riding-xlu-impressive-rally/