McDonald’s (MCD) is the world’s largest fast food restaurant chain, serving over 69 million customers daily in over 100 countries in more than 40,000 outlets as of 2021. It is best known for its hamburgers, cheeseburgers and french fries, although their menu also includes other items like chicken, fish, fruit, and salads.
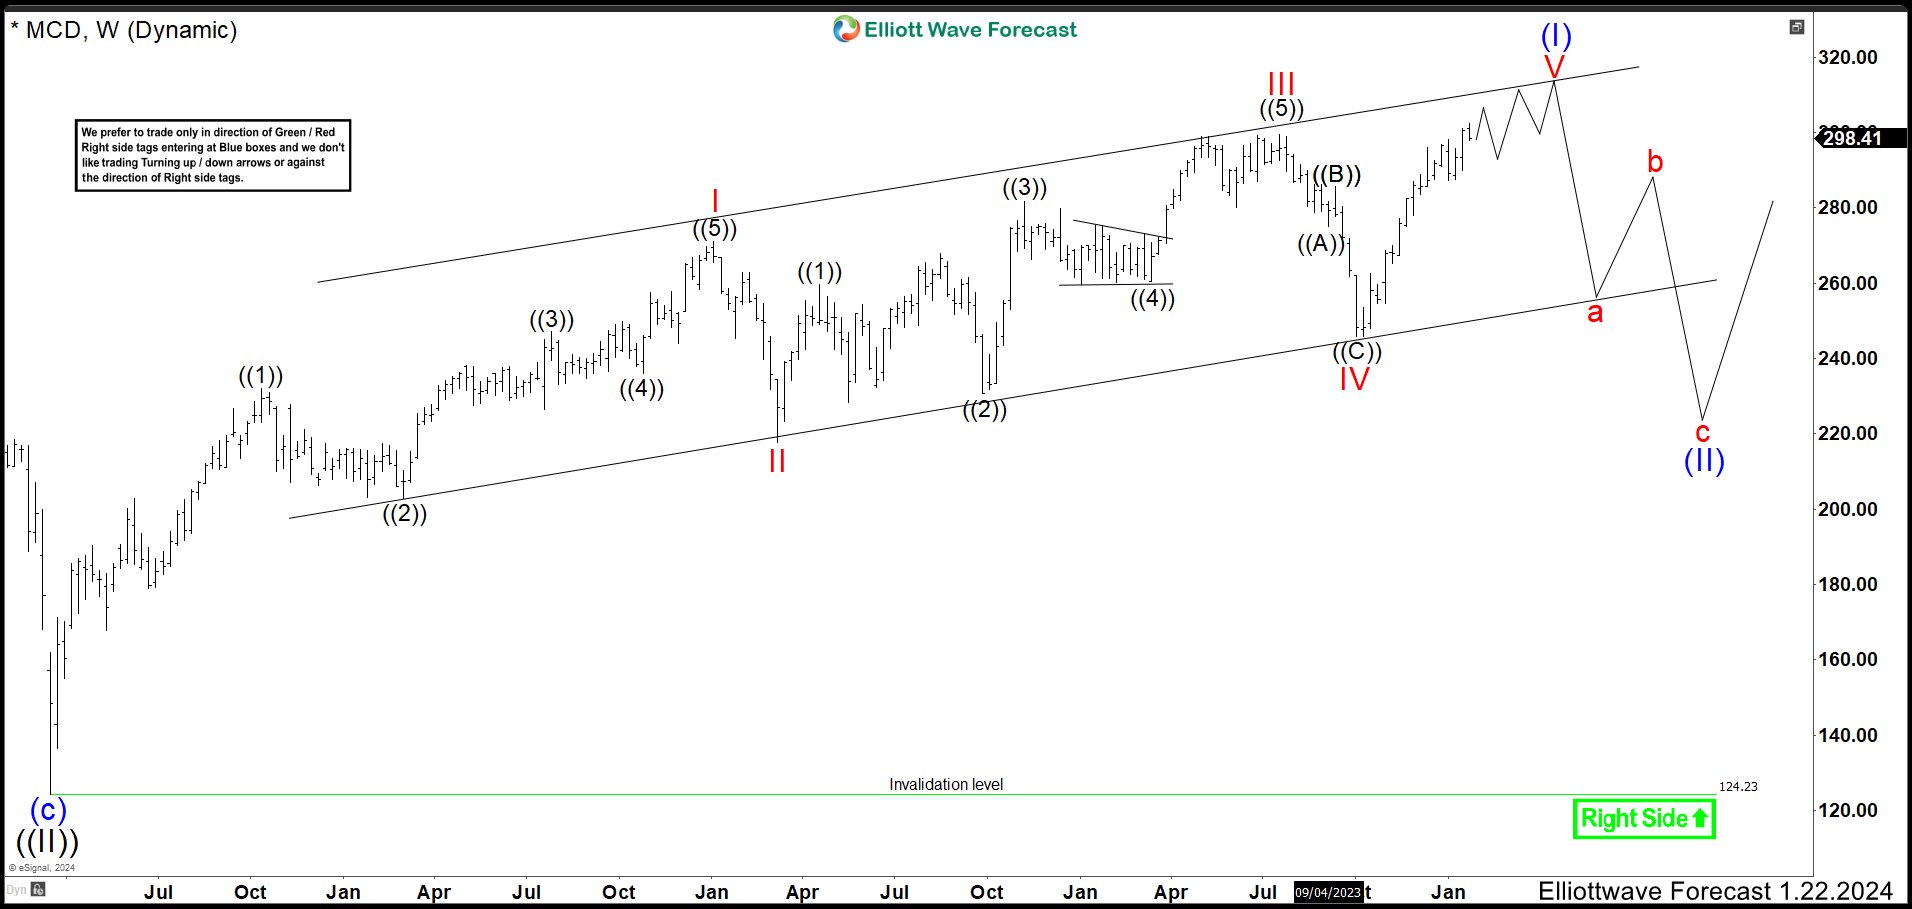
McDonald’s MCD Weekly Chart January 2024

In March 2020, MCD ended a corrective cycle as wave ((II)) at 124.23 low and continued the rally. The new structure could have built a leading diagonal as wave (I); therefore, we called wave I completed at 271.15 high and pullback as wave II ended at 217.68 low. The market resumed to the upside in a choppy way finished wave III at 299.35 high. Next correction as wave IV ended a zig zag structure at 245.73 low and MCD rally again. Last January, we called that wave V of (I) should end soon and see a pullback in wave (II).
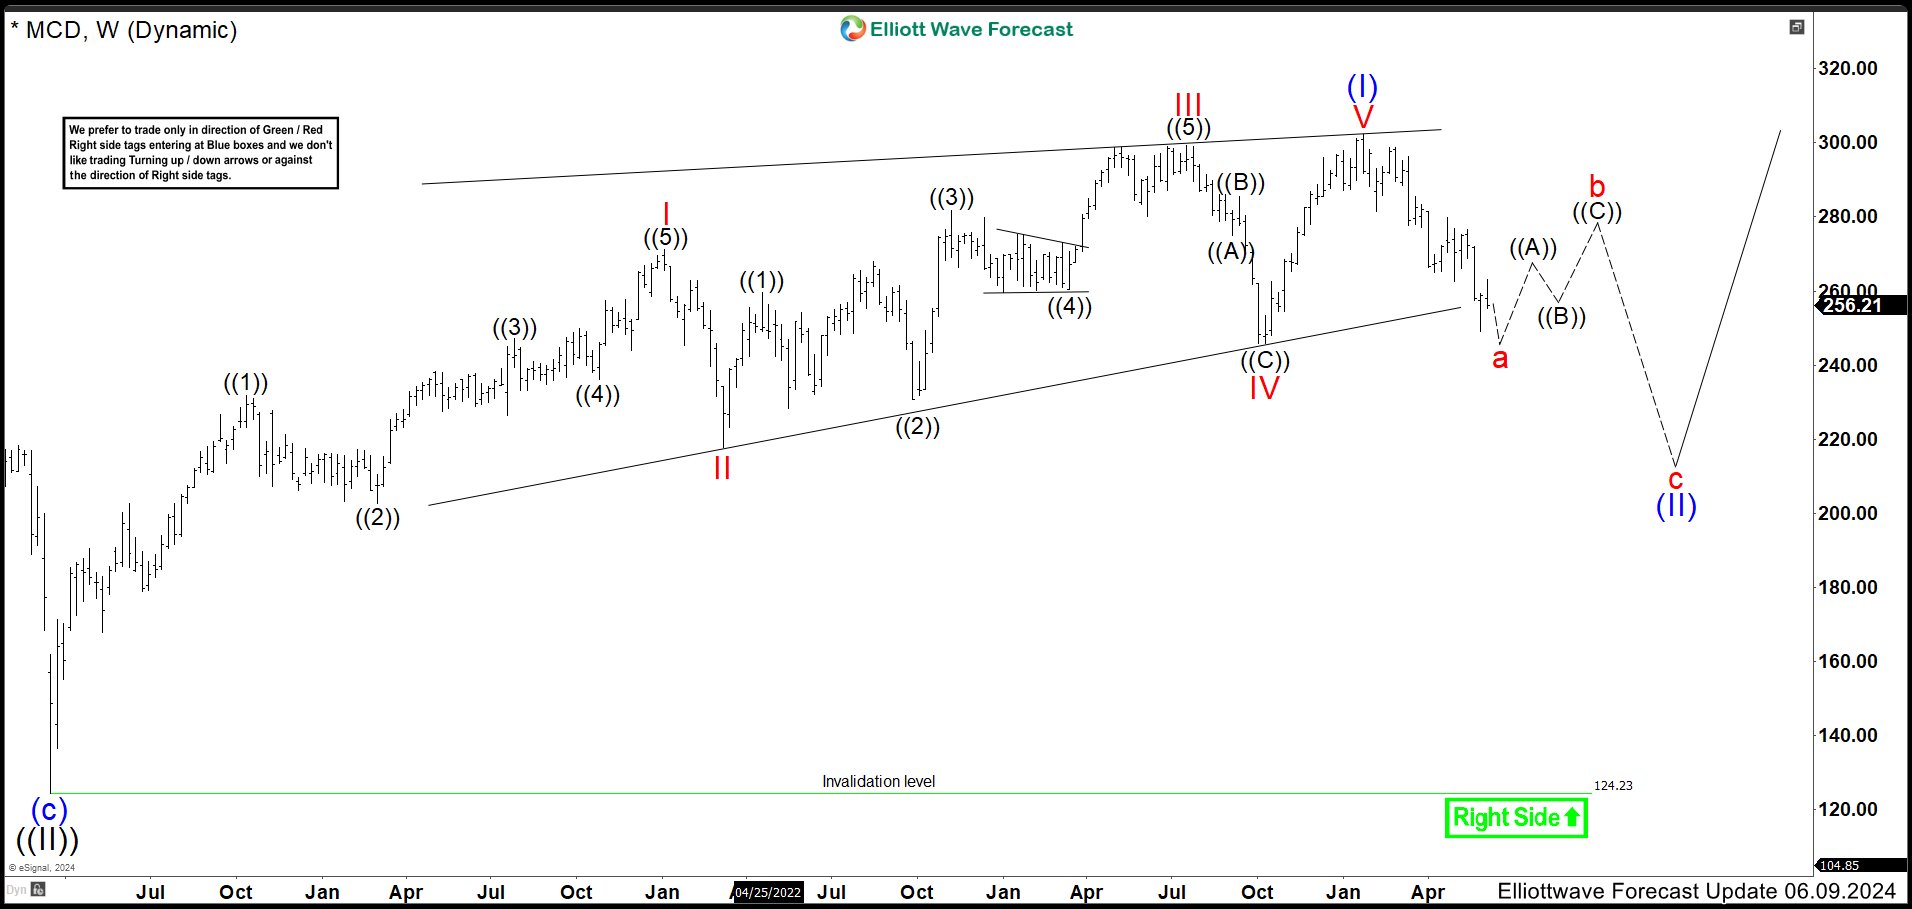
McDonald’s MCD Weekly Chart June 2024

After 5 months, we called wave V of (I) ended almost immediately at 302.39 high and started wave (II) correction. We believed that wave “a” of (II) has not ended yet. We expected to drop to 245.79 – 240.41 area (1.236 – 1.618 inverse Fib retracement) where buyers should appear to see 3 or 7 swings bounce in wave “b” before resuming lower in wave “c” of (II) to end the correction.
McDonald’s MCD Weekly Chart October 2024
However, after one more low to complete wave “a”, MCD rallied again avoiding a deep correction as (II). Therefore, we are proposing a nest (I), (II) and I, II to continue to the upside. This means that as price action remains above 243.53 low, it should to the upside. Currently, we are calling a wave ((2)) pullback. This correction could drop to 281 – 271 area where buyers should be waiting to continue the rally in wave ((3)) of III. Only if the market breaks below 243,53 low, that we cannot rule out, we will return to the first idea, that wave (II) is in progress.
Source: https://elliottwave-forecast.com/stock-market/mcd-built-nest-structure-pullback/

