Berkshire Hathaway Inc. (NYSE: BRK.B) is trading to the upside within a strong Bullish trend since October 2022. In this article, we dive into the latest developments and signals that suggest a promising bullish trajectory based on Elliott Wave Theory.
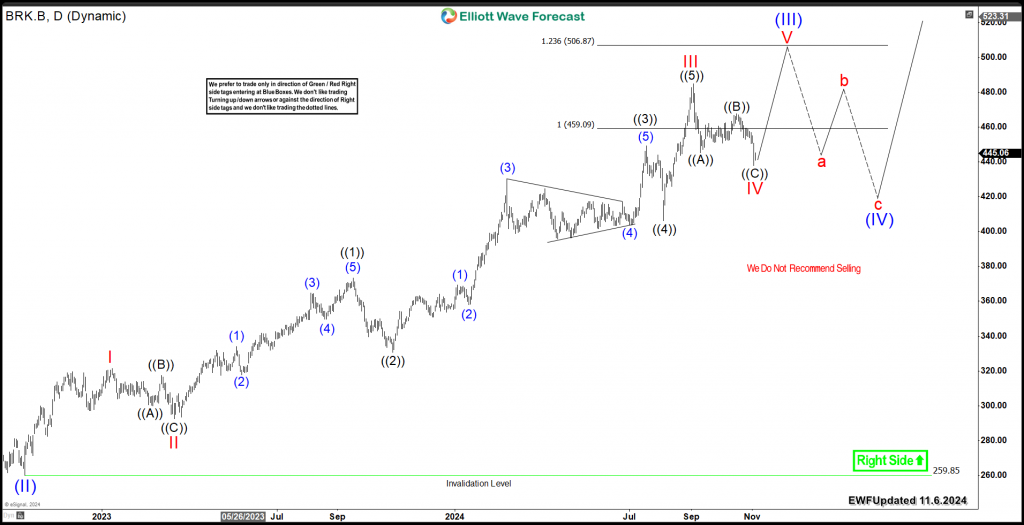
BRK.B is looking to establish an impulsive 5 waves advance before ending 2022 cycle. Wave I at $321, wave II at $292 and It ended wave III in September 2024 at $484. Down from there, the stock started a pullback in wave IV which is expected to find buyers in 3 , 7 or 11 swings to resume the rally higher again in wave V.

We can see in the above daily chart that BRK.B is showing 3 swings down from the peak and it’s looking to finish the Zigzag structure in wave IV pullback then makes a turn to the upside. Consequently, if the stock resume the rally into new all time highs above September peak, then it can be looking for targets higher at extreme area $506 – $584 before it ends the 5 waves advance from 2022 low and start a larger 3 waves pullback.
To sum up, the trajectory of Berkshire Hathaway continues to be bullish and investors are advised to look for buying opportunities during forthcoming daily retracements in 3 , 7 or 11 swings.
Source: https://elliottwave-forecast.com/stock-market/berkshire-hathaway-brk-b-bullish-trend/

