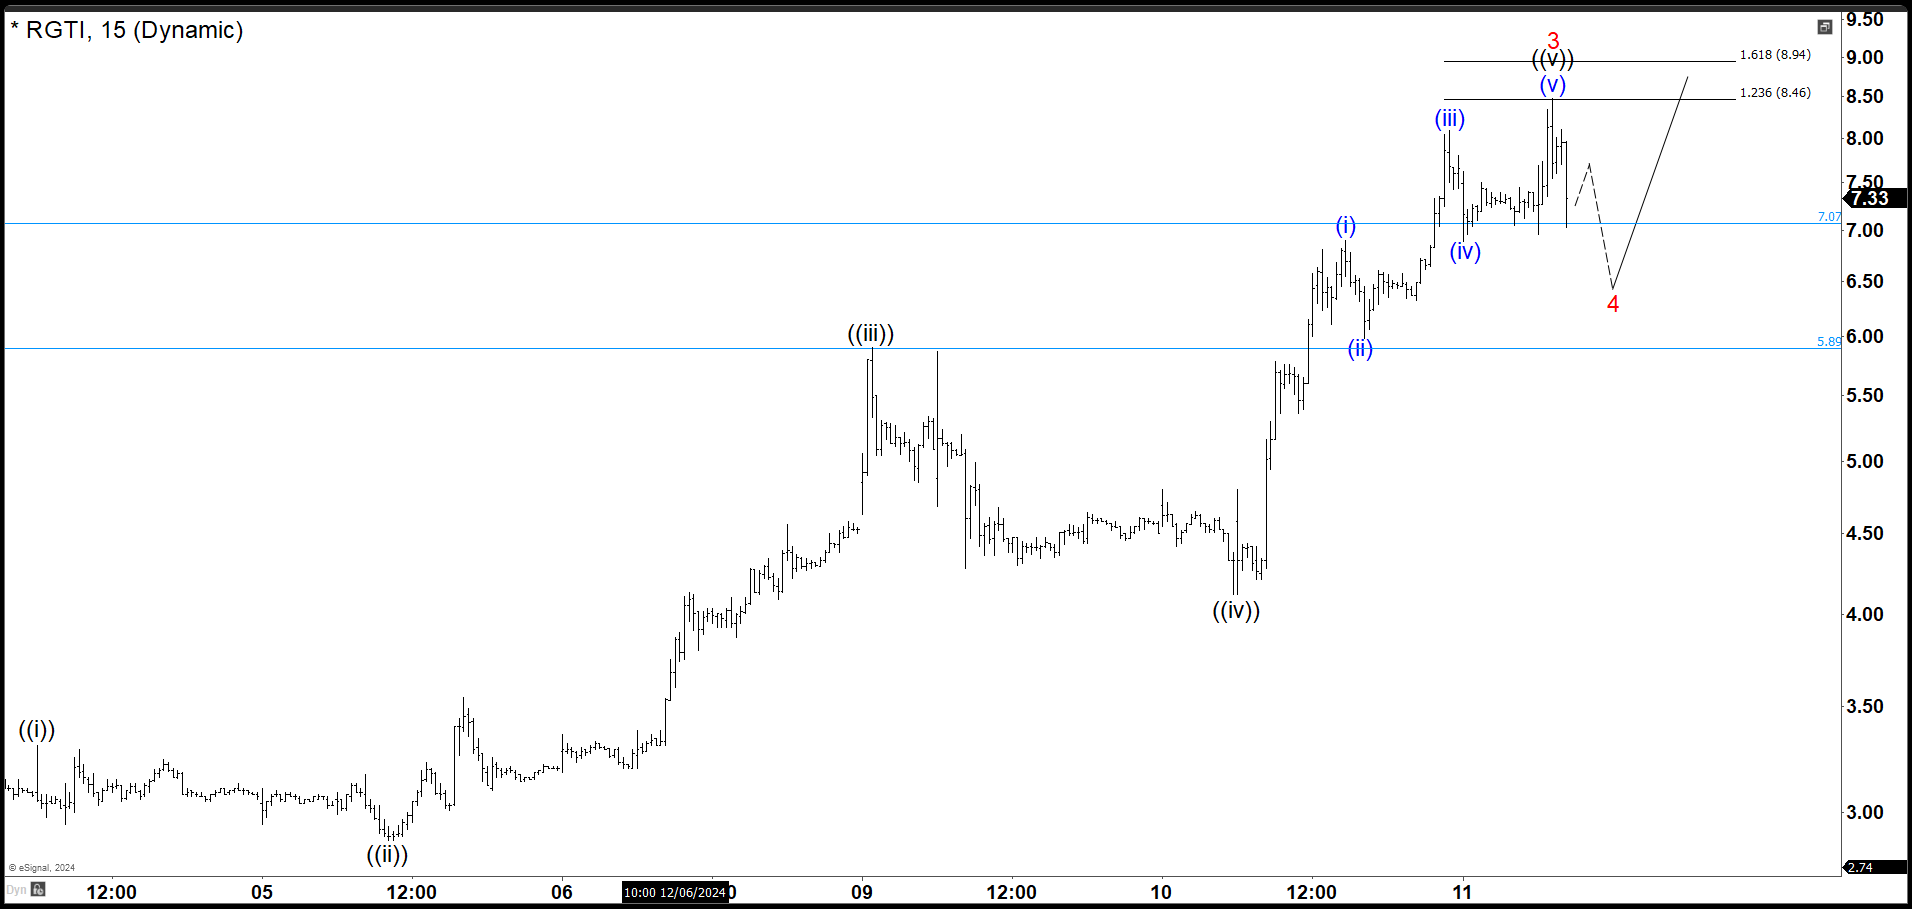
RGTI has risen rapidly in value in recent days attracting the attention of investors. Here we have the 15-minute chart. Applying the Elliott Waves principle, the stock should find support in 5.89 – 7.07 area to complete a wave 4. This would generate a new rally on wave 5 that could reach around 8.94 – 10.25 or extend higher.
RGTI 15 Min Chart 12.11.2024

In any case, as long as the market respects the 5.89 – 7.07 area, RGTI must continue with the upward movement and break above wave 3 to reach at least 8.94 – 10.25. If the market were to break below 7.00, it would open the possibility that the value of the stock will drop to 4.00 before looking for another move higher.
Source: https://elliottwave-forecast.com/stock-market/rgti-looking-support-area/

