The Global X Uranium ETF (URA) is an exchange-traded fund (ETF) that seeks to provide investment results that correspond generally to the price and yield performance of the Solactive Global Uranium & Nuclear Components Total Return Index. In this article, we will look at the long term technical outlook using Elliott Wave method.
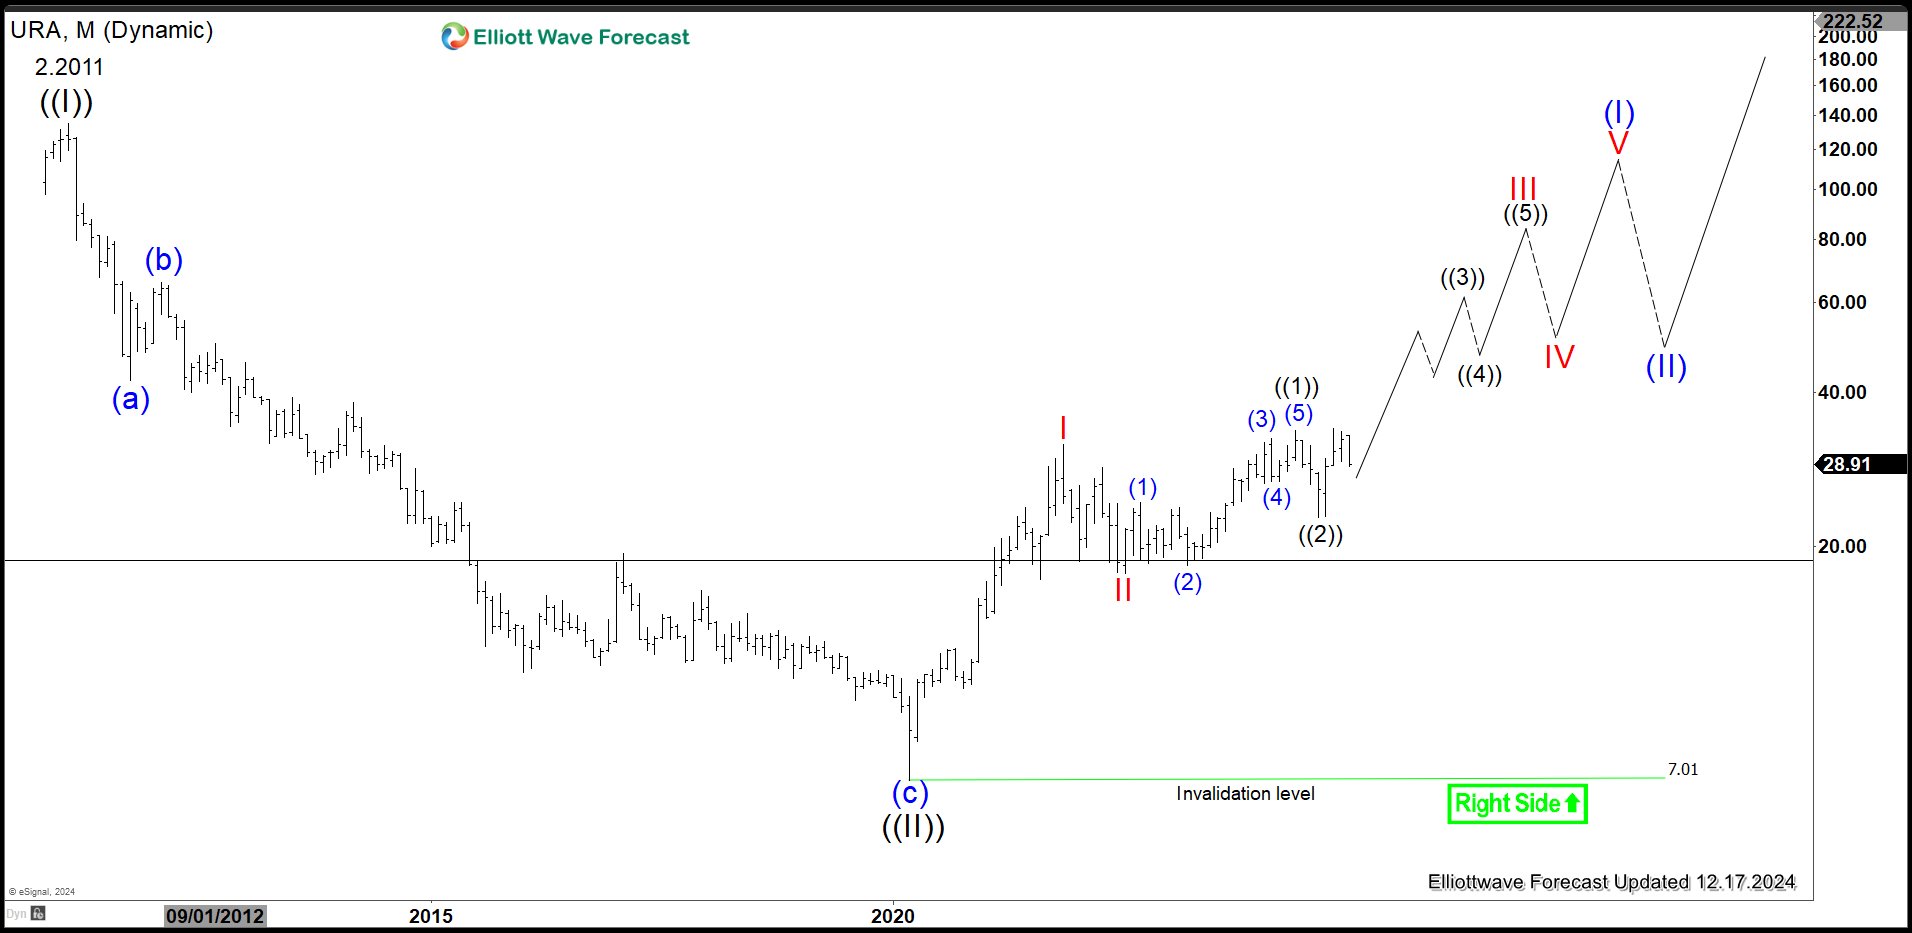
$URA Elliott Wave Chart Monthly Chart

Uranium ETF (URA) Monthly Chart shows the EF has a bullish sequence after ending wave ((II)) at 7.01. Up from there, wave I ended at 31.6 and pullback in wave II ended at 17.65. The ETF then nested higher in impulsive structure with wave ((1)) ended at 33.66 and pullback in wave ((2)) ended at 22.79. Expect the ETF to continue higher in wave ((3)). Overall, it’s bullish against March 2020 low at 7.01 and pullback should find support in 3, 7, 11 swing.
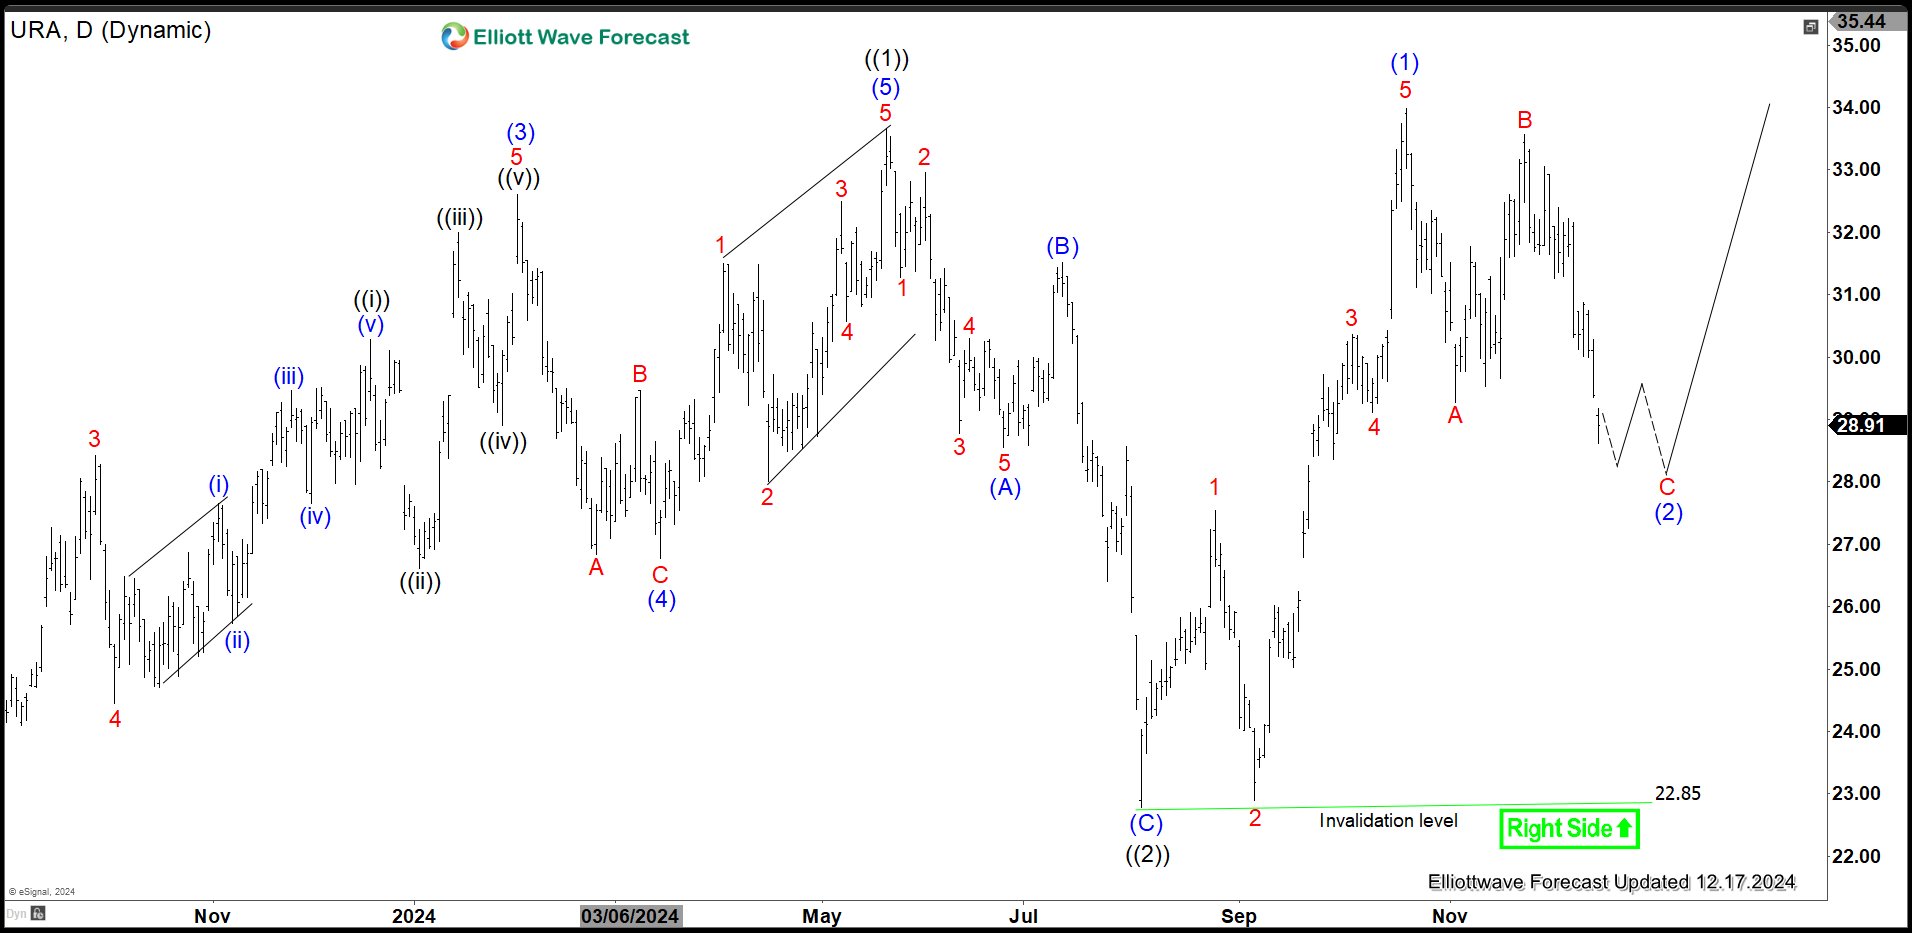
$URA Daily Elliott Wave Chart

Daily chart above shows that rally to 33.66 ended wave ((1)) on May 20, 2024 high. Pullback in wave ((2)) ended a t 22.85 with internal subdivision as a zigzag Elliott Wave structure. Down from wave ((1)), wave (A) ended at 28.56 and wave (B) rally ended at 31.52. Wave (C) lower ended at 22.85 which completed wave ((2)) in higher degree. The ETF has turned higher in wave ((3)). Up from wave ((2)), wave 1 ended at 27.55 and wave 2 dips ended at 22.89. Wave 3 higher ended at 30.37 and pullback in wave 4 ended at 29.11.
Final leg wave 5 higher ended at 33.99 which completed wave (1) in higher degree. Wave (2) pullback is in progress to correct cycle from 8.5.2024 low in zigzag structure before it resumes higher. Near term, as far as pivot at 22.85 low stays intact, expect dips to find support in 3, 7, 11 swing for more upside.
Source: https://elliottwave-forecast.com/stock-market/uranium-miners-etf-ura-correction-find-support/

