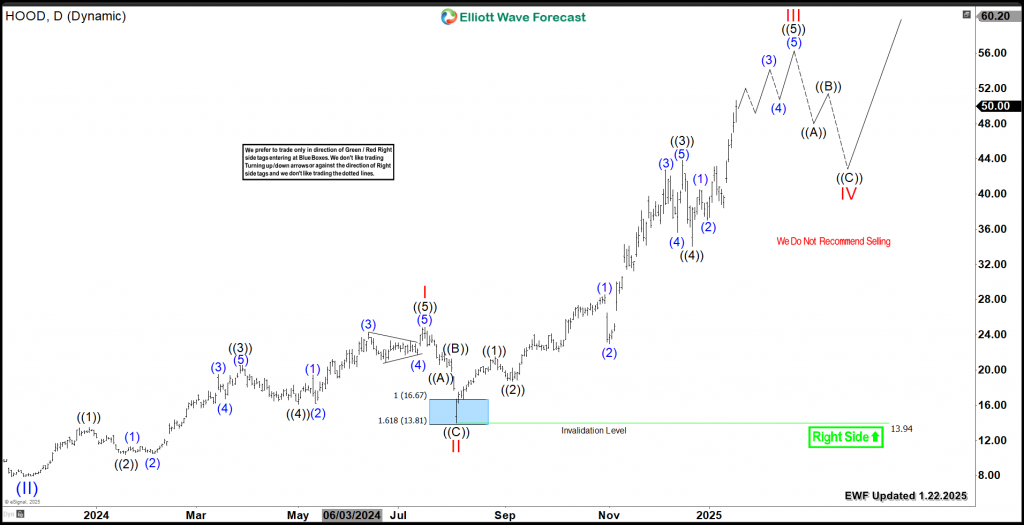
Since our previous blog about Robinhood stock HOOD, the price tripled during a strong bullish upside move. Therefore, we’ll be looking at the daily Elliott Wave Structure and explain the current structure within the cycle.
The recent daily rally started in August 2024, HOOD established an impulsive 5 waves structure to the upside within wave III. In addition, it exceeded the 1.618 Fibonacci extension level $41 which confirmed the strong momentum within the 3rd wave. The current advance from 12/20/2024 low is proposed to be wave ((5)) of III as long as it’s holding the divergence in RSI. Consequently, the stock will be looking for more upside to finish a series of 3rd & 4th waves toward $52 – $56 before ending that cycle.
HOOD still has the potential of opening more upside above if the structure turns out to be a nest. In that case, the current move will be wave ((3)) of III and it will reach equal legs area at $63 – $82. In conclusion, we don’t recommend selling the stock as the overall structure for remains bullish and we only favor buying the daily pullbacks in 3 , 7 or 11 swings.
HOOD Daily Chart 1.22.2025

Source: https://elliottwave-forecast.com/stock-market/robinhood-hood-extension/

