
TXN gained 34% from the blue box where buyers went long in April 2024. While the stock has maintained the long term bullish sequence, the pullback from November 2024 may present another trading opportunity for buyers from the dip. In this blog post, we will explore this opportunity and see if we could get another perfect entry.
Texas Instruments Incorporated (TXN) is a well-established American technology company headquartered in Dallas, Texas. It’s known primarily for its semiconductor and integrated circuit products, which are used in a wide range of applications including industrial, automotive, consumer electronics, and telecommunications. In this post, we will look at the TXN Elliott Wave Analysis.
TXN Elliott Wave Analysis – 11th April, 2024
After breaking above the October 2021 high, TXN formed a new peak in November 2024. This confirmed a clear impulse sequence from the December 2018 low. After the November 2024 peak, the stock started a pullback. This pullback is still incomplete, giving buyers enough time to wait for the best entry at the extreme. This setup is similar to one we shared on April 12, 2024. Click here to read it again.
In that blog post, we used the chart below. On the H4 chart, the price completed wave 1, followed by a wave 2 pullback. After that, the price turned higher and broke above the wave 1 top with wave ((i)) of 3. So, we recommended buying at the extreme of wave ((ii)), as shown in the chart below. The blue box highlighted the buy zone with entry at 164.2 the stop at 157.36.
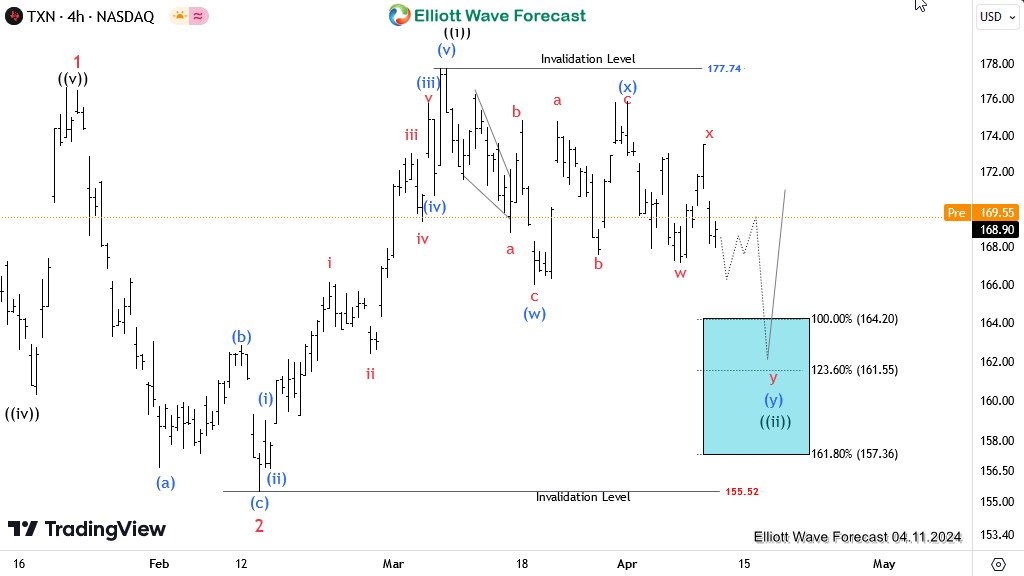
Latest TXN H4 Chart – 3rd February, 2024

The chart above is the latest H4 showing the reaction from the blue box. From there, TXN prices soared 34% before it peaked again. From the peak of November 2024, the stock is in another pullback. Could this present another opportunity for buyers?
TXN Elliott Wave Analysis – 3rd February, 2024

The chart shows price is most likely correcting the bullish cycle from the late October 2023 low. It was within the same cycle we had the last trade shared earlier. The current pullback is forming a 7-swing structure. Waves (W) and (Y) of ((2)) ended in December 2024 and January 2025. Now, a new blue box has appeared for buyers.
Here is the latest trade recommendation.
Long at 163.56
Stop at 140.5
Target at 255.5
Profit Management: Take partial profit at 50% of C of (Y) of ((2)) and adjust the rest to the low of wave C of (Y) of ((2))
Source: https://elliottwave-forecast.com/stock-market/txn-gained-34-blue-box/