
Hello fellow traders,
In this technical article we’re going to take a look at the Elliott Wave charts charts of EURUSD forex pair published in members area of the website. As our members know, recently EURUSD made a 3-wave pullback that completed right at the equal legs level. In the following sections, we will analyze the charts and explain the Elliott Wave forecast.
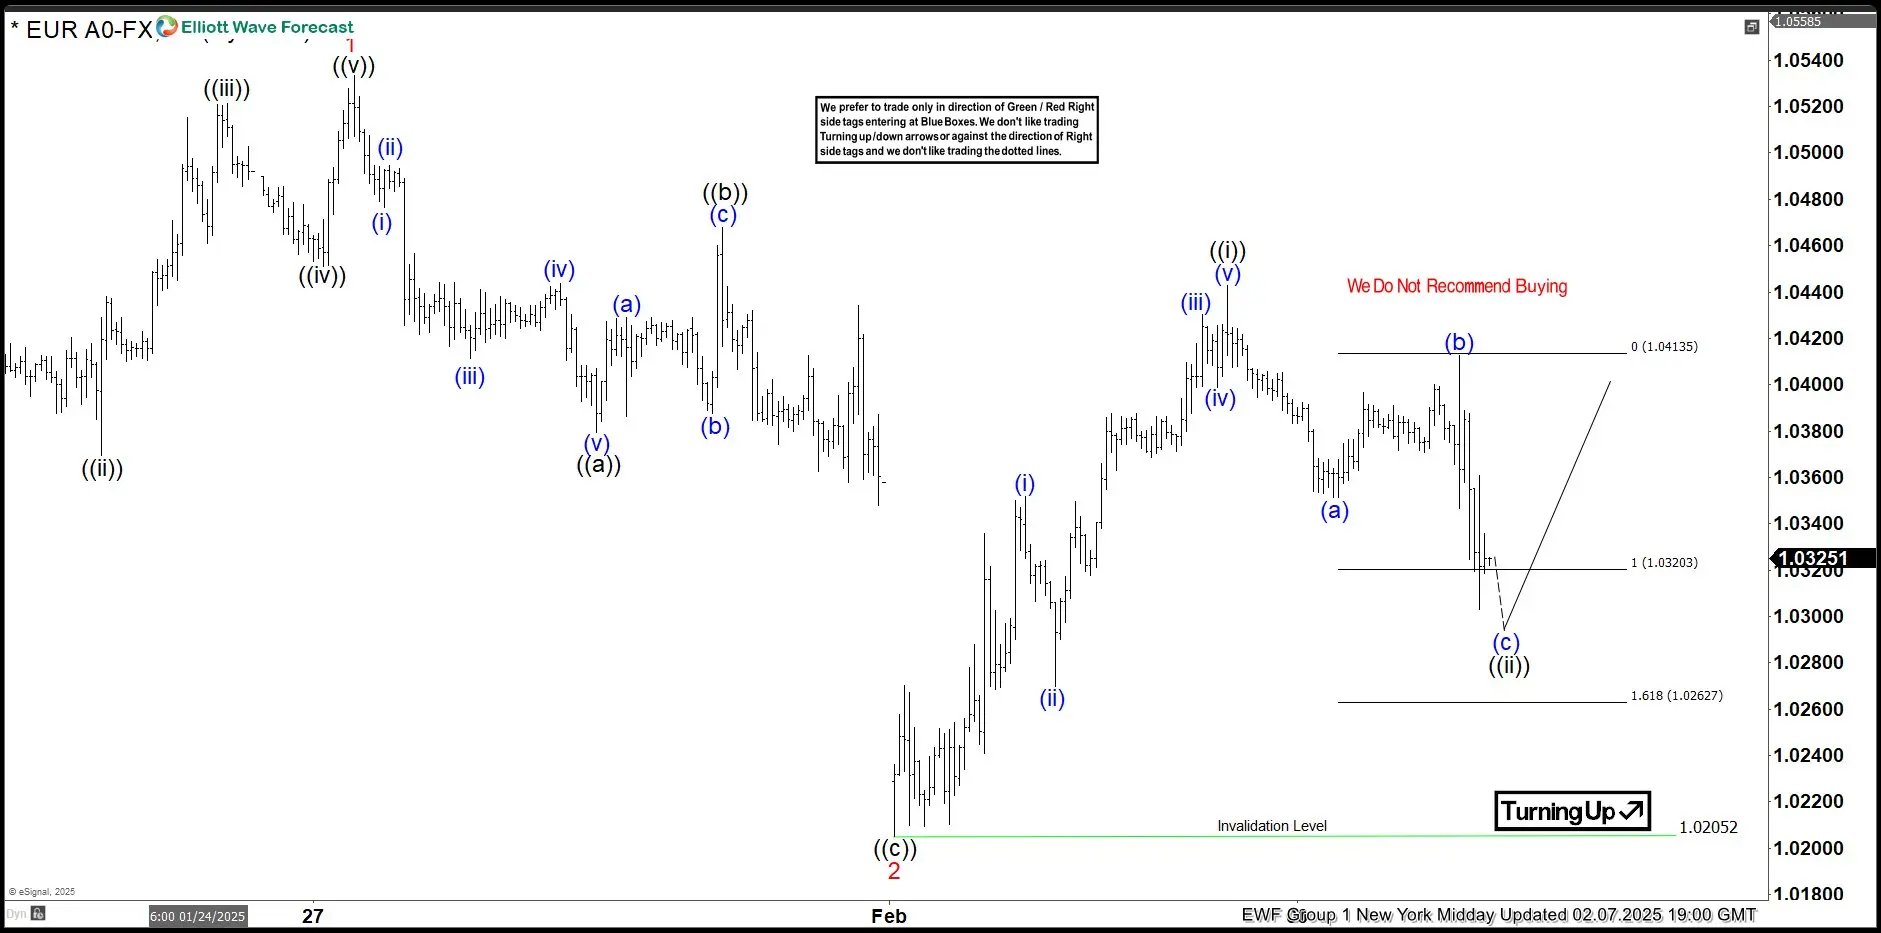
EURUSD Elliott Wave 1 Hour Chart 02.07.2025
EURUSD ended cycle from the 1.0205 low as 5 waves structure- wave ((i)) black. The pair is currently giving us pull back against the 1.0205 low. Equal legs area is already reached at 1.0320-1.0262 area. We are aware that pull back can complete any moment. Although we expect to see rally from the marked area, we don’t recommend forcing the trades at this stage.
Reminder : You can learn more about Elliott Wave Patterns at our Free Elliott Wave Educational Web Page.
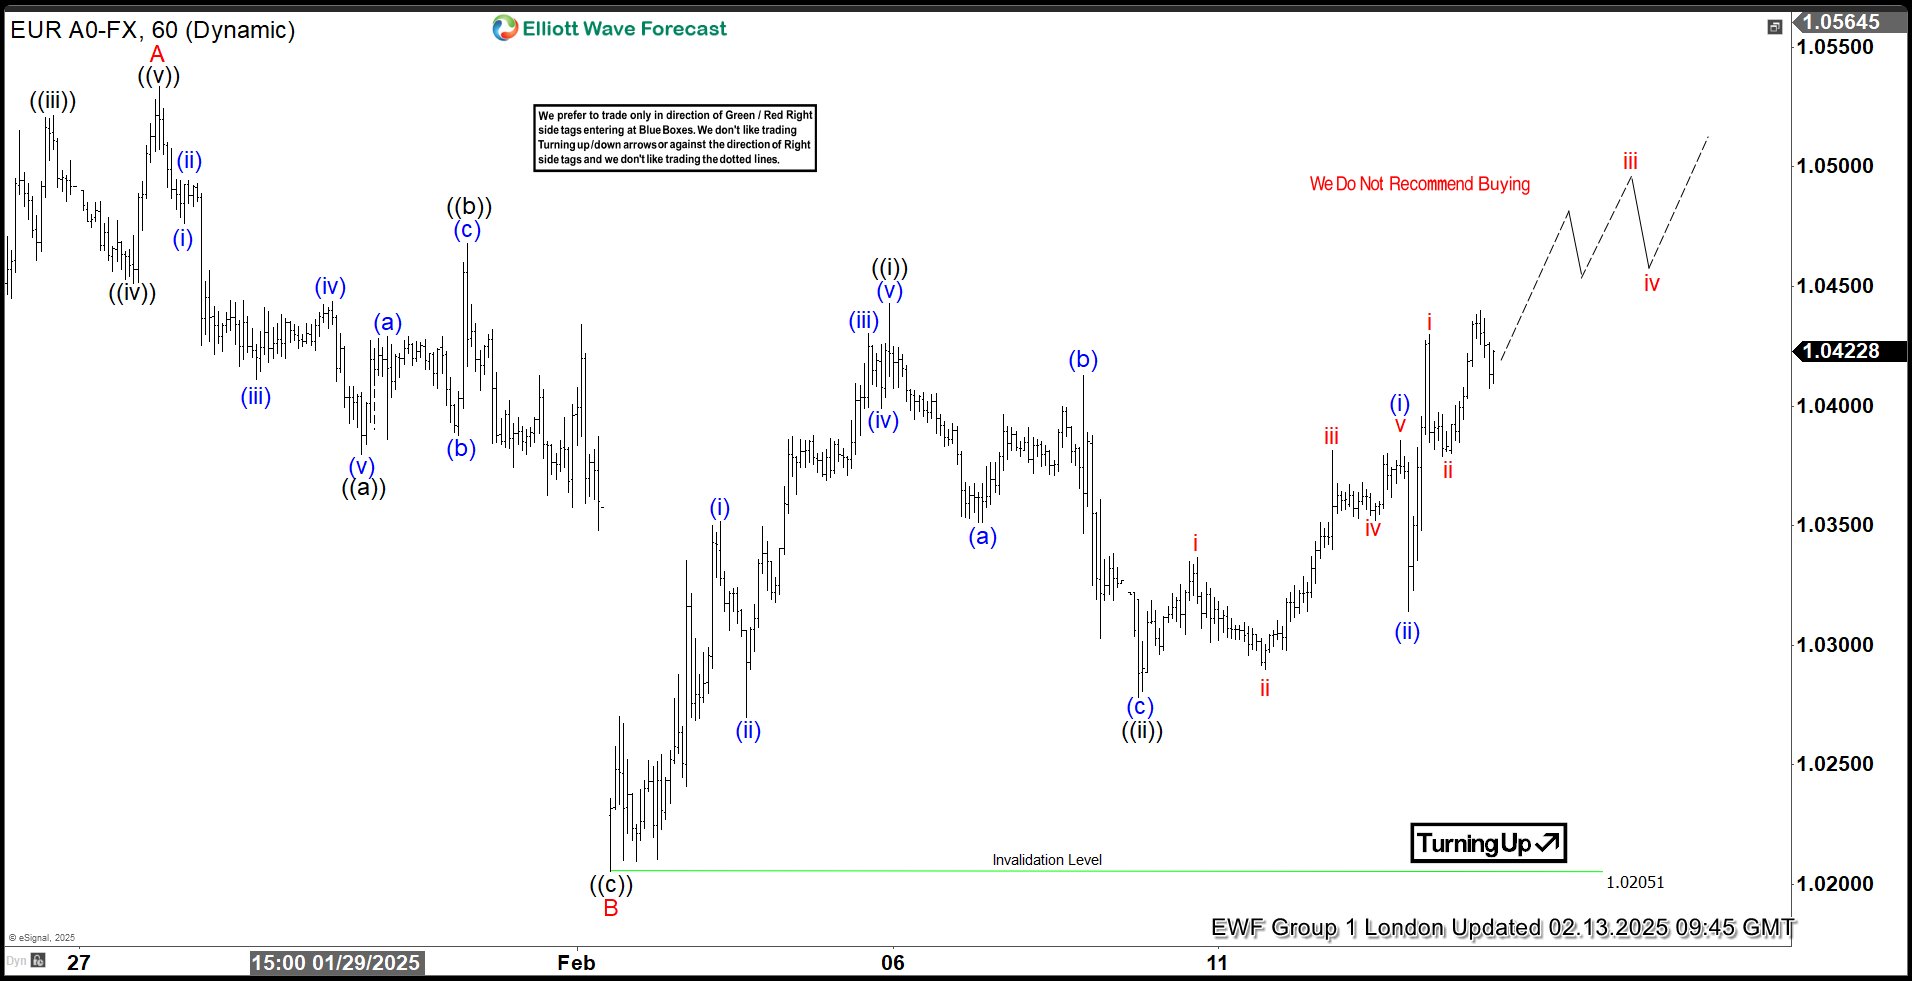
EURUSD Elliott Wave 1 Hour Chart 02.07.2025
The pair found buyers in the 1.0320-1.0262 area as expected and completed the correction at the 1.0286 low. We’d like to see a break of the ((i)) black peak to confirm further upward movement toward the 1.05129-1.05671 area.
90% of traders fail because they don’t understand market patterns. Are you in the top 10%? Test yourself with this advanced Elliott Wave Test
Reminder for members: Our chat rooms in the membership area are available 24 hours a day, providing expert insights on market trends and Elliott Wave analysis. Don’t hesitate to reach out with any questions about the market, Elliott Wave patterns, or technical analysis. We’re here to help.
Source: https://elliottwave-forecast.com/forex/eurusd-found-buyers/