
Johnson & Johnson (JNJ) is an American multinational corporation founded in 1886 that develops medical devices, pharmaceuticals, and consumer packaged goods. Its common stock is a component of the Dow Jones Industrial Average, and the company is ranked No. 36 on the 2021 Fortune 500 list of the largest United States corporations by total revenue.
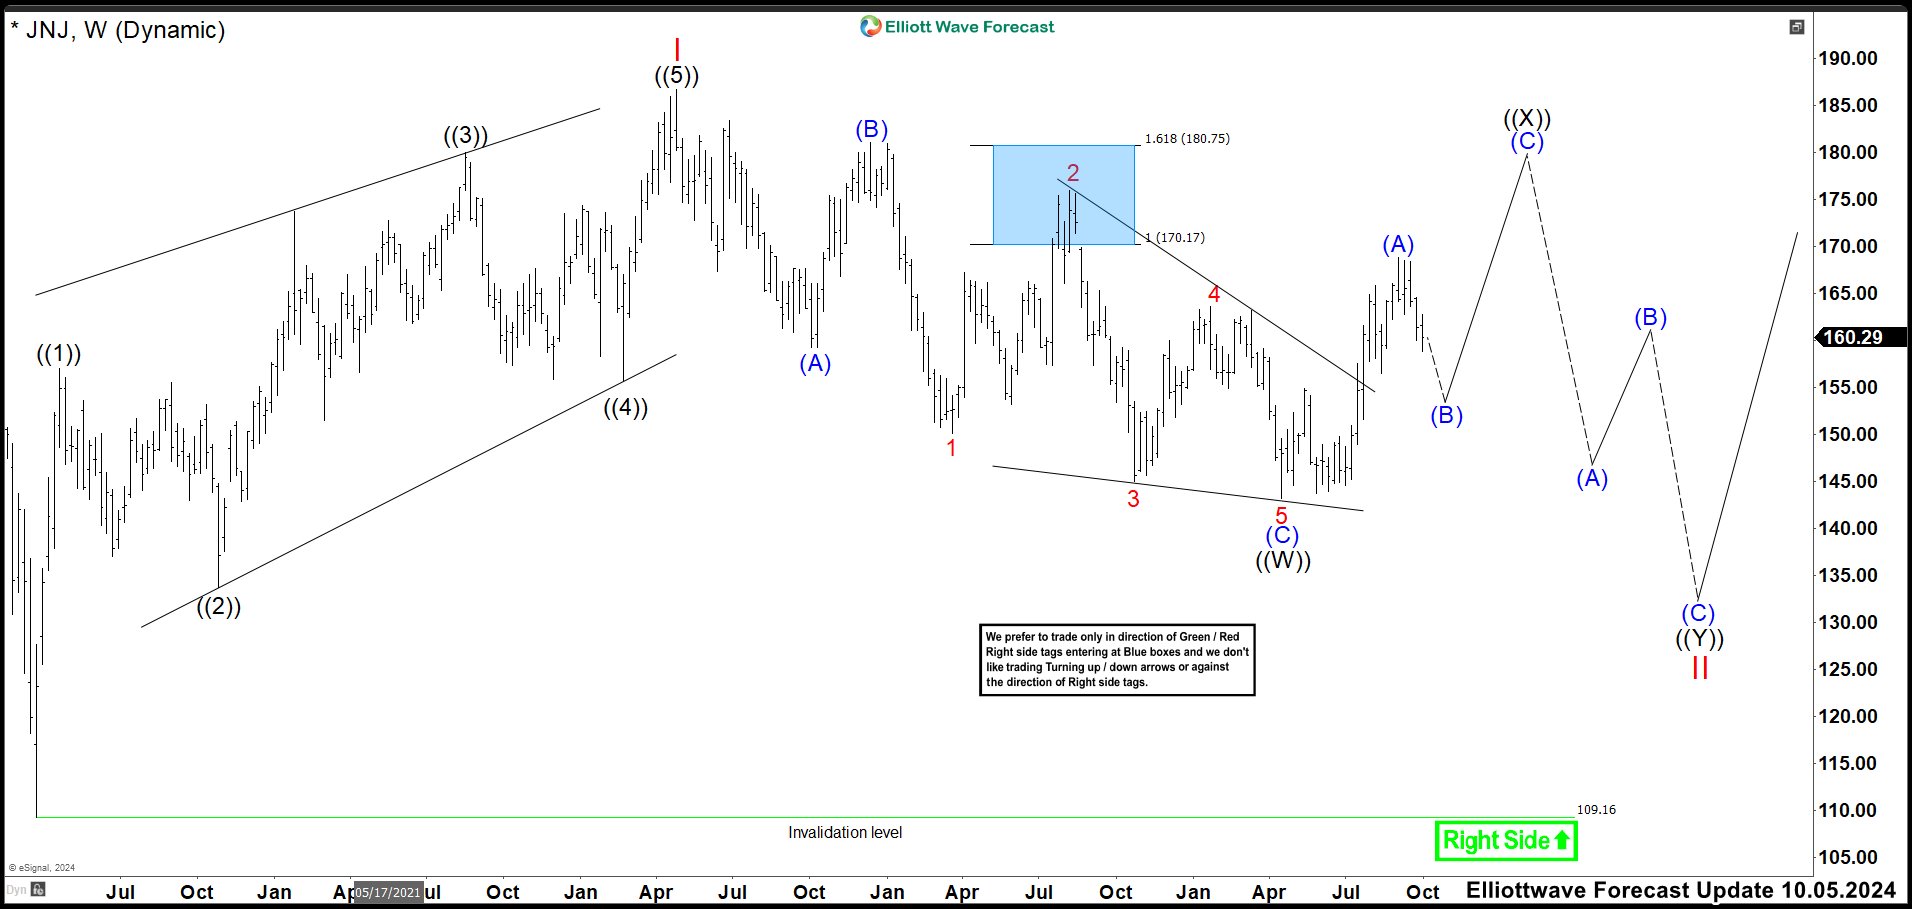
JNJ Weekly Chart October 2024
Above we have last JNJ weekly chart updated. We can see the rally as expected ending wave (A) at 168.85 high and it was pulling back in wave (B). As minimum we were looking for an (A), (B), (C) structure to complete wave ((X)) before resuming lower in wave ((Y)). However, we cannot rule out for now that JNJ breaks above wave I developing an impulse. If that happens, it is very possible that wave II could be completed.
JNJ Weekly Chart February 2025
Here is the last weekly chart on JNJ. The first thing we can see is that wave (B) was very deep, even breaking below the low of wave ((W)). For this reason, the (A), (B), (C) structure we are looking for has transformed into a flat correction. This means that wave (C), which is currently trading, must build a bullish impulse. The ideal area for this impulse to end is between 166.36 – 182.27, thus completing the flat correction and the connector ((X)). We need to see a bearish reaction from this zone to consider that wave ((X)) has concluded. If so, the market should make three more downward swings to complete wave ((Y)) and the double correction as wave II. As we mentioned before, if JNJ does not show a bearish reaction in this zone, wave II could have already ended, and we would only see more upward movement
JNJ Daily Chart February 2025
I posted this daily chart to show you what we should expect from the impulse as wave (C) from the 140.55 low. The easiest way to see this is to expect more upside to complete wave 3. When you see a strong reaction lower, it does not mean that the cycle is complete; it means that wave 4 has started. You should look to the low of wave ((iv)) as a possible support for wave 4 and expect a new rally from there. If you see a new rally after wave 4, then wave 5 is underway. You should see 5 waves in a lesser degree to complete the impulse and the whole structure of wave ((X)). Let see what the market bring us. Trade Smart!
Source: https://elliottwave-forecast.com/stock-market/johnson-jnj-rally-might-short-lived/