
McDonald’s (MCD) stock is on track to deliver moderate growth throughout 2025. Analysts expect an average price target of $323.39, offering a potential upside of 5.79% from its current level. Furthermore, monthly forecasts highlight price fluctuations between $282 and $370, influenced by market conditions. Menu innovation, digital initiatives, and geographic diversification strengthen its position and reinforce its resilience against macroeconomic challenges.
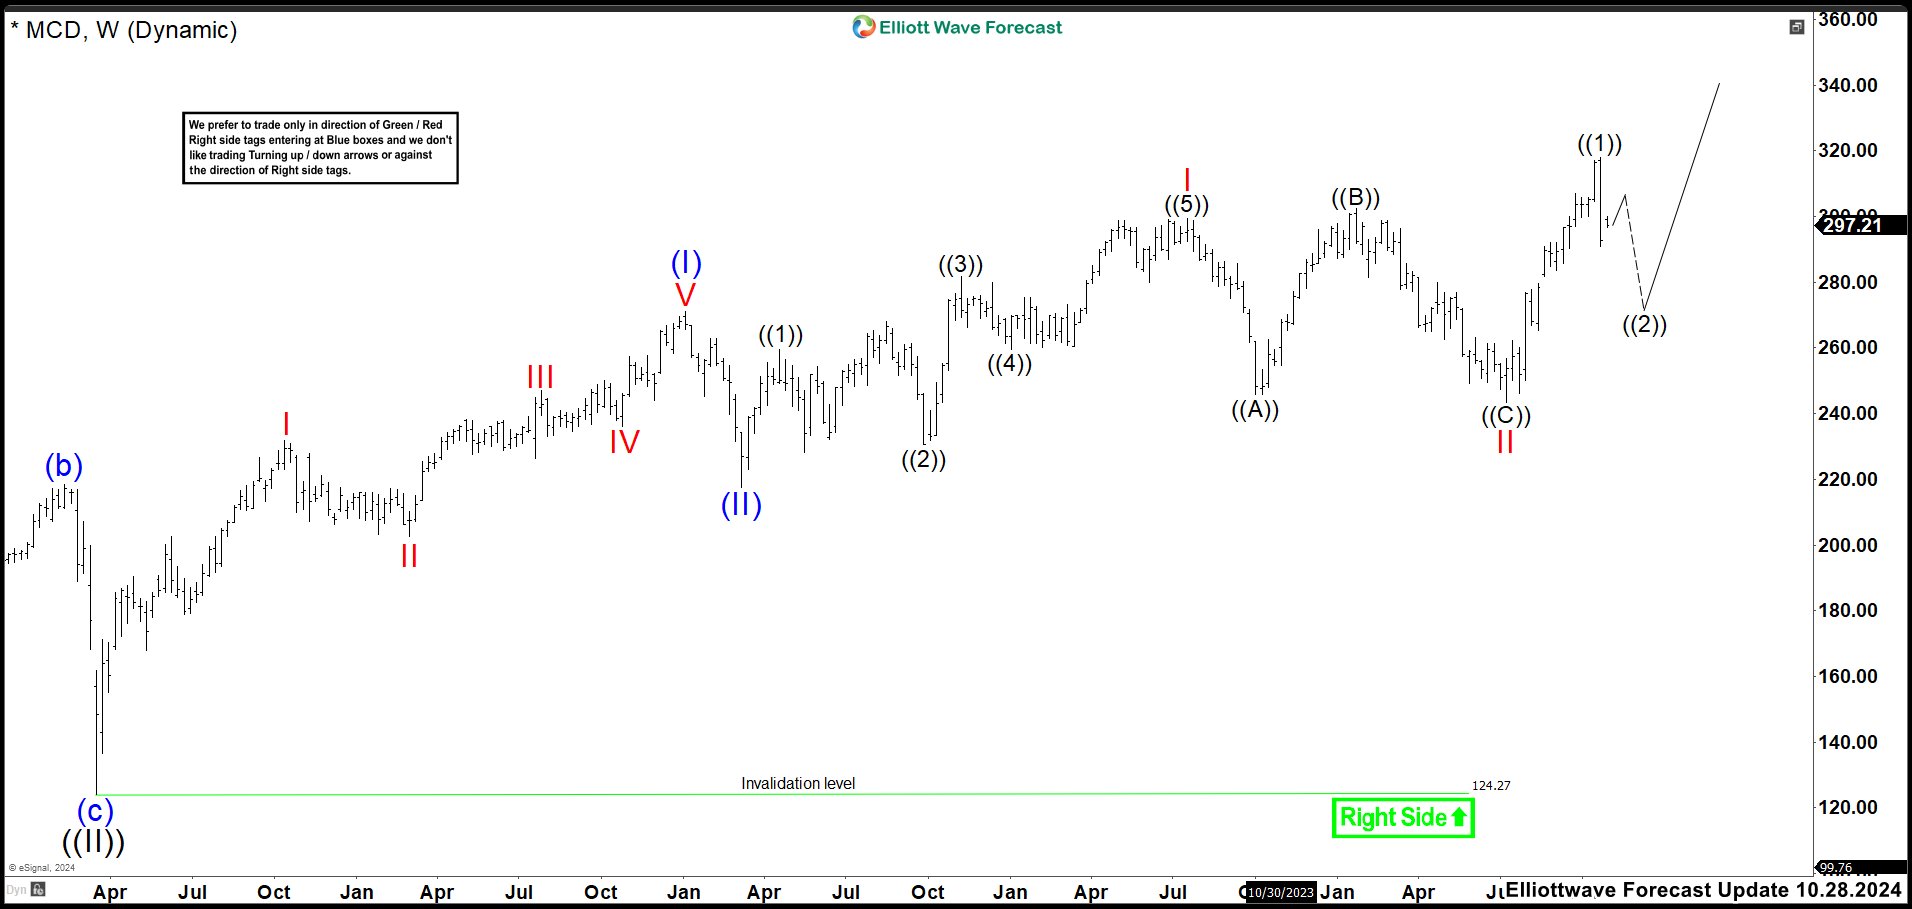
McDonald’s MCD Weekly Chart October 2024
Previously, we identified a potential nest structure for MCD, including waves (I), (II), I, II, and ((1)), ((2)), pointing to further upside movement. The bullish outlook remained intact while price action stayed above the 243.53 low. We expected a wave ((2)) pullback, targeting the 281–271 area, where buyers were likely ready to support a rally in wave ((3)). However, we acknowledged that if the market broke below the 243.53 low, it could signal a return to the earlier idea of wave (II) still being in progress.
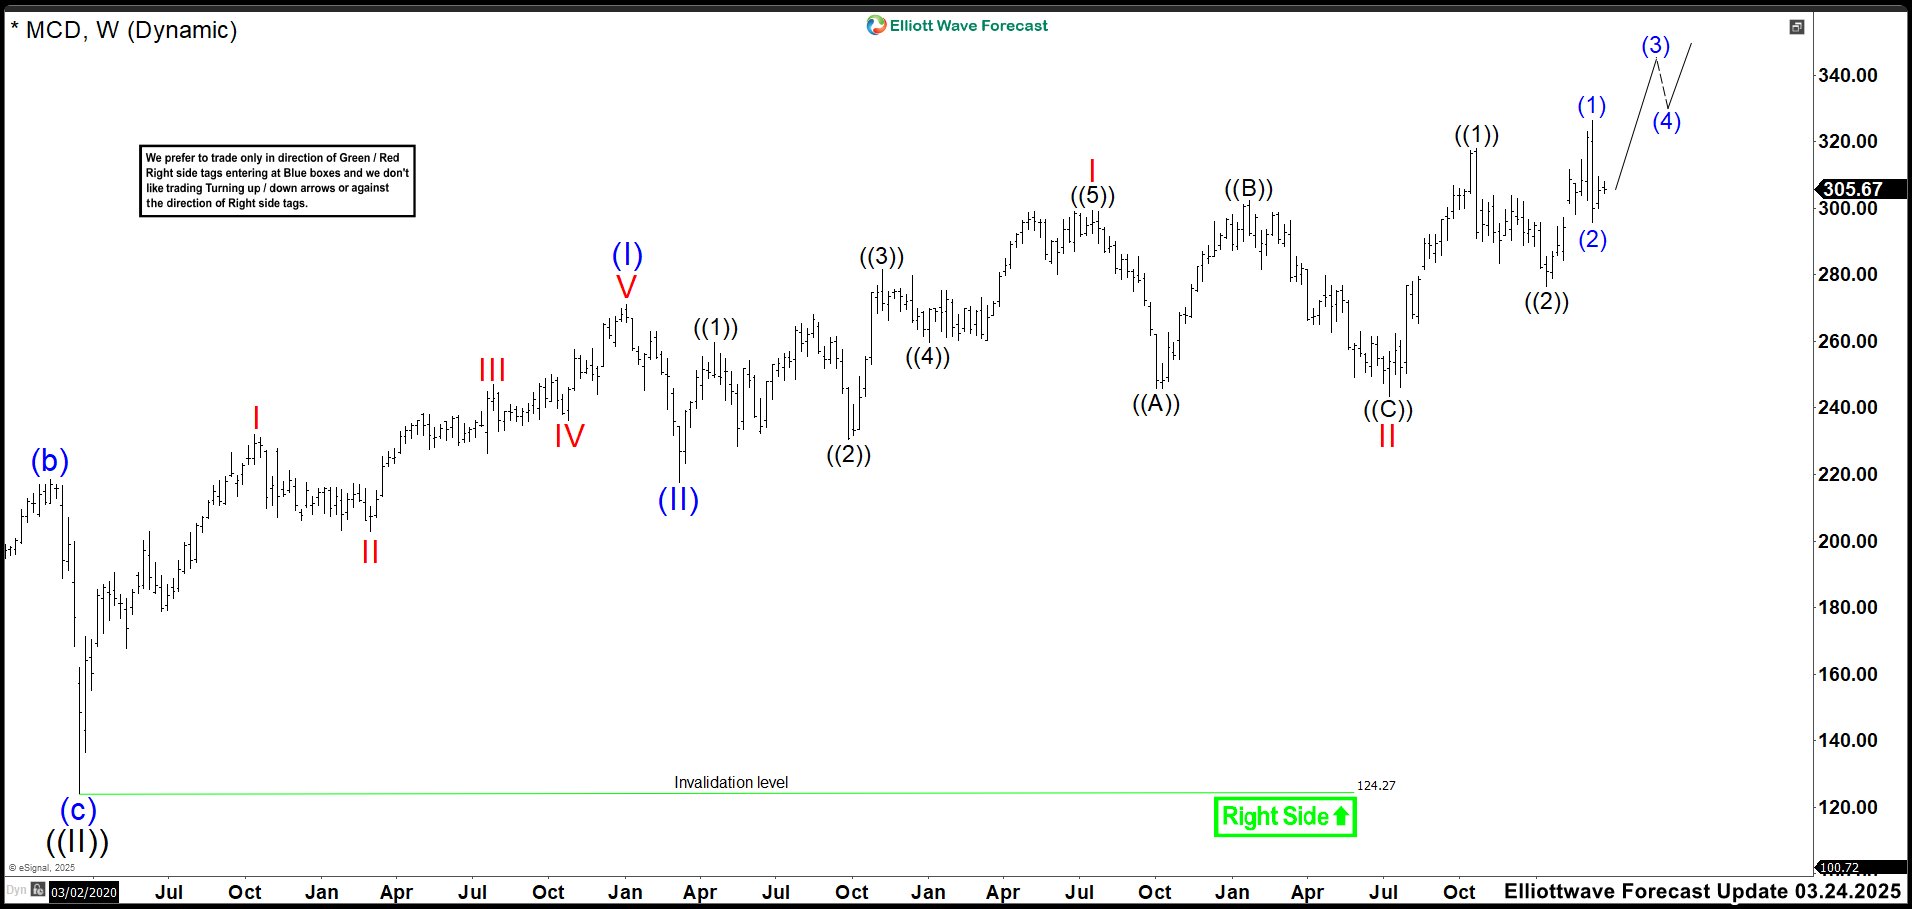
McDonald’s MCD Weekly Chart March 2025
The market successfully completed its correction in wave ((2)), precisely reaching the projected zone of 281–271 and settling at the 276.80 low. The price action reacted strongly to the upside aligning with our bullish expectations. Moreover, MCD is now trading in wave ((3)) of III, having already completed waves (1) and (2). As long as the market remains above wave (2), the upward movement is expected to continue, further reinforcing the bullish outlook. However, a break below wave (2) or ((2)) would not indicate a bearish trend. Instead, it would suggest that the correction is still ongoing. Nonetheless, the bullish trend ultimately remains intact, providing traders with exciting opportunities in the market.
Source: https://elliottwave-forecast.com/stock-market/mcd-continuing-bullish-momentum/