
Hello fellow traders,
In this technical article, we are going to present Elliott Wave charts of QQQ ETF . As our members know QQQ is trading within the cycle from the 396 low. Recently the ETF has reached the extreme zone from the April 9th peak and found buyers as expected. In the following sections, we will explain the Elliott Wave forecast.
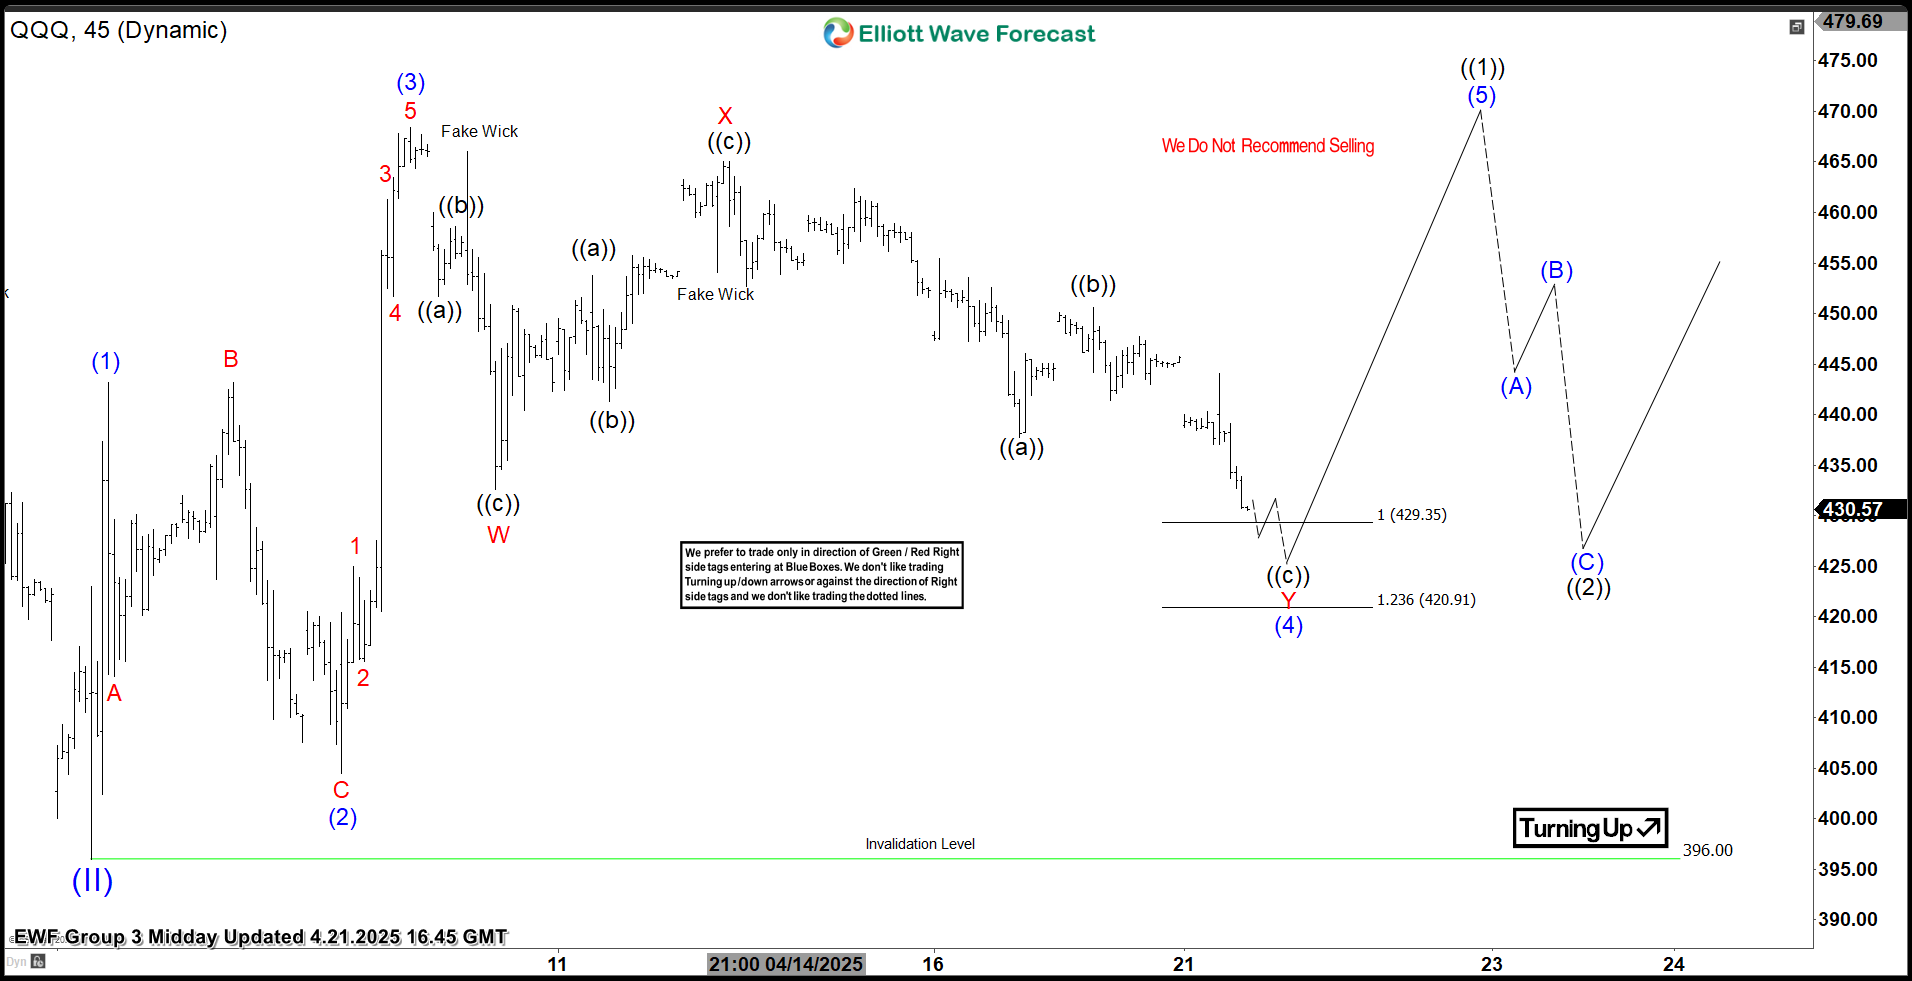
QQQ Elliott Wave 1 Hour Chart 04.21.2025
The current view suggests QQQ is about to complete the cycle from the peak. Correction is reaching the extreme zone at 429.35-420.91 area. At that zone buyers should re-enter, which could lead to a further rally toward new highs or in a 3 waves bounce at least. We recommend that members avoid selling QQQ and keep favoring the long side.
Official trading strategy on How to trade 3, 7, or 11 swing and equal leg is explained in details in Educational Video, available for members viewing inside the membership area.
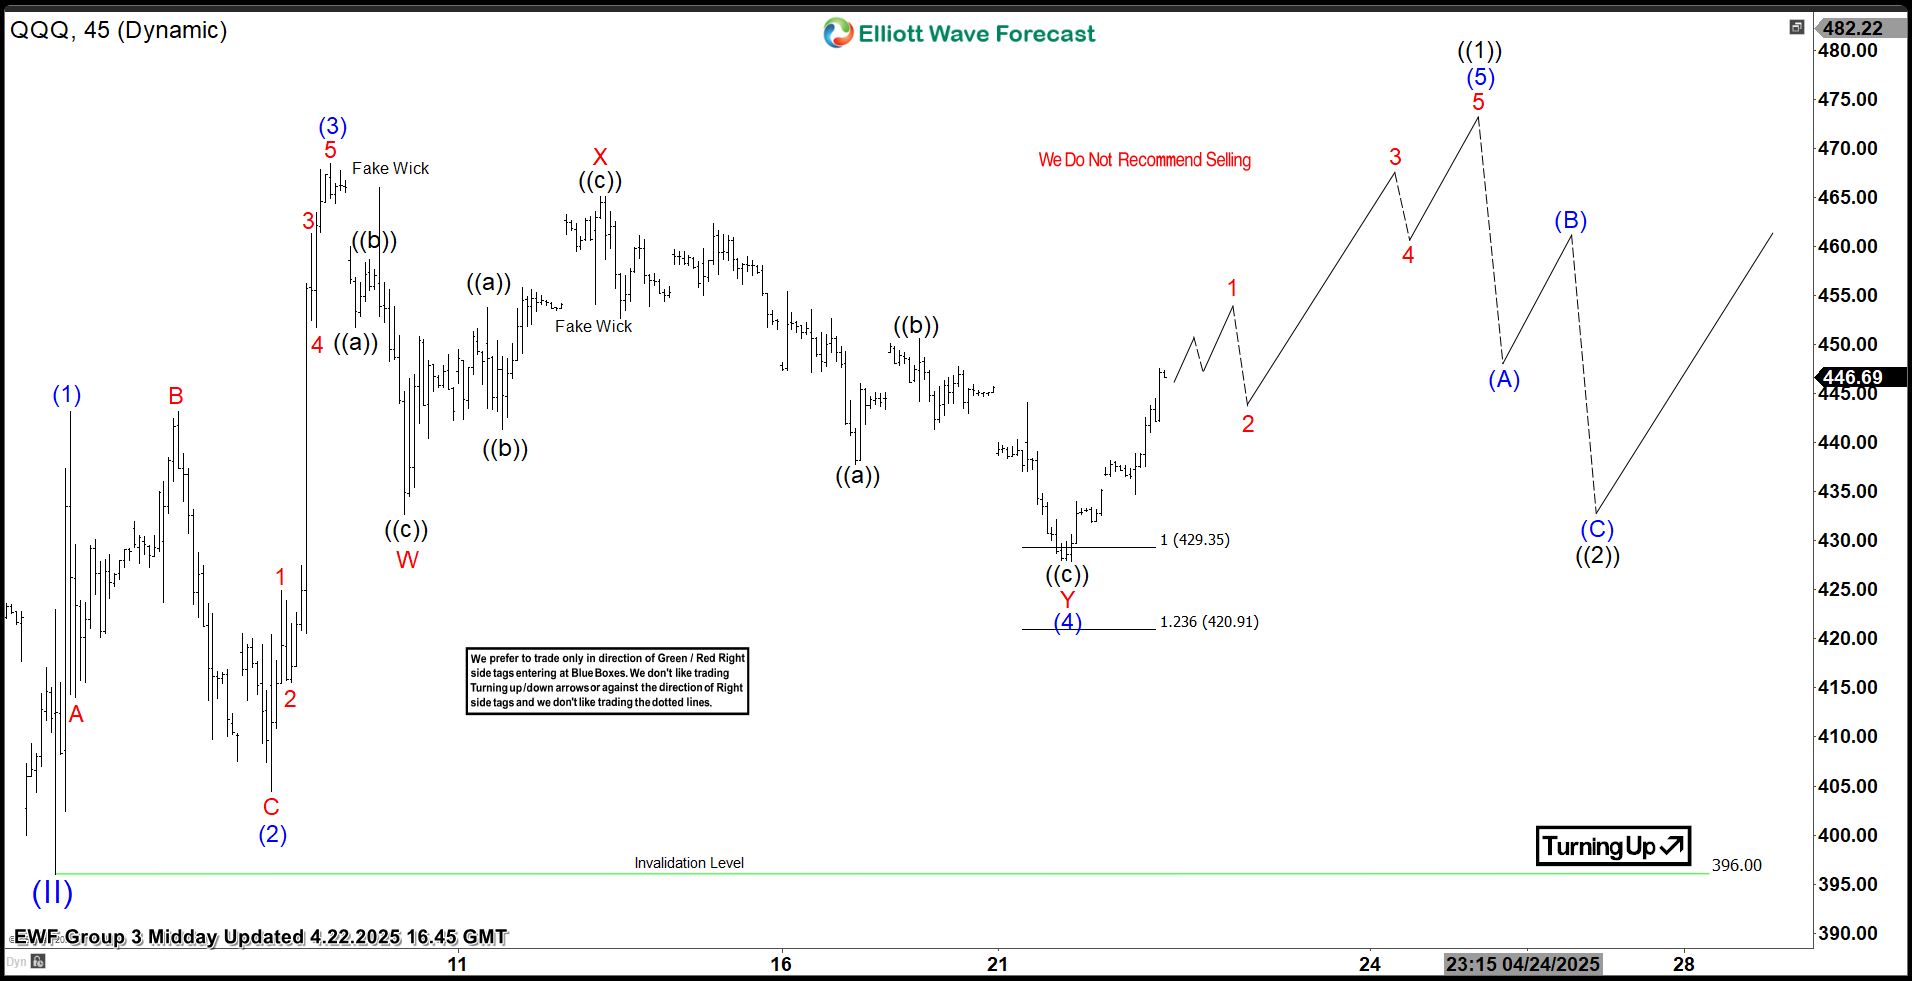
QQQ Elliott Wave 1 Hour Chart 04.10.2025
QQQ found buyers, and made decent reaction from the Equal Legs zone : 429.35-420.91. Cycle from the peak ended at 428.3 low. As far as the price stays above that low, we can see further strength in the ETF. As a result, any long trades from the marked zone should be in risk-free positions with partial profits taken.
Reminder for members: Our chat rooms in the membership area are available 24 hours a day, providing expert insights on market trends and Elliott Wave analysis. Don’t hesitate to reach out with any questions about the market, Elliott Wave patterns, or technical analysis. We’re here to help.
90% of traders fail because they don’t understand market patterns. Are you in the top 10%? Test yourself with this advanced Elliott Wave Test
Source: https://elliottwave-forecast.com/stock-market/qqq-elliott-wave-rally-equal-legs/