The Global X Uranium ETF (URA) tracks a market-cap-weighted index of companies in the uranium mining and nuclear components sector. The ETF, featuring key holdings like Cameco Corp, has a market cap of approximately $3.9 billion and a dividend yield of about 6.07%. Elliott Wave Technical Analysis point to continued growth potential.
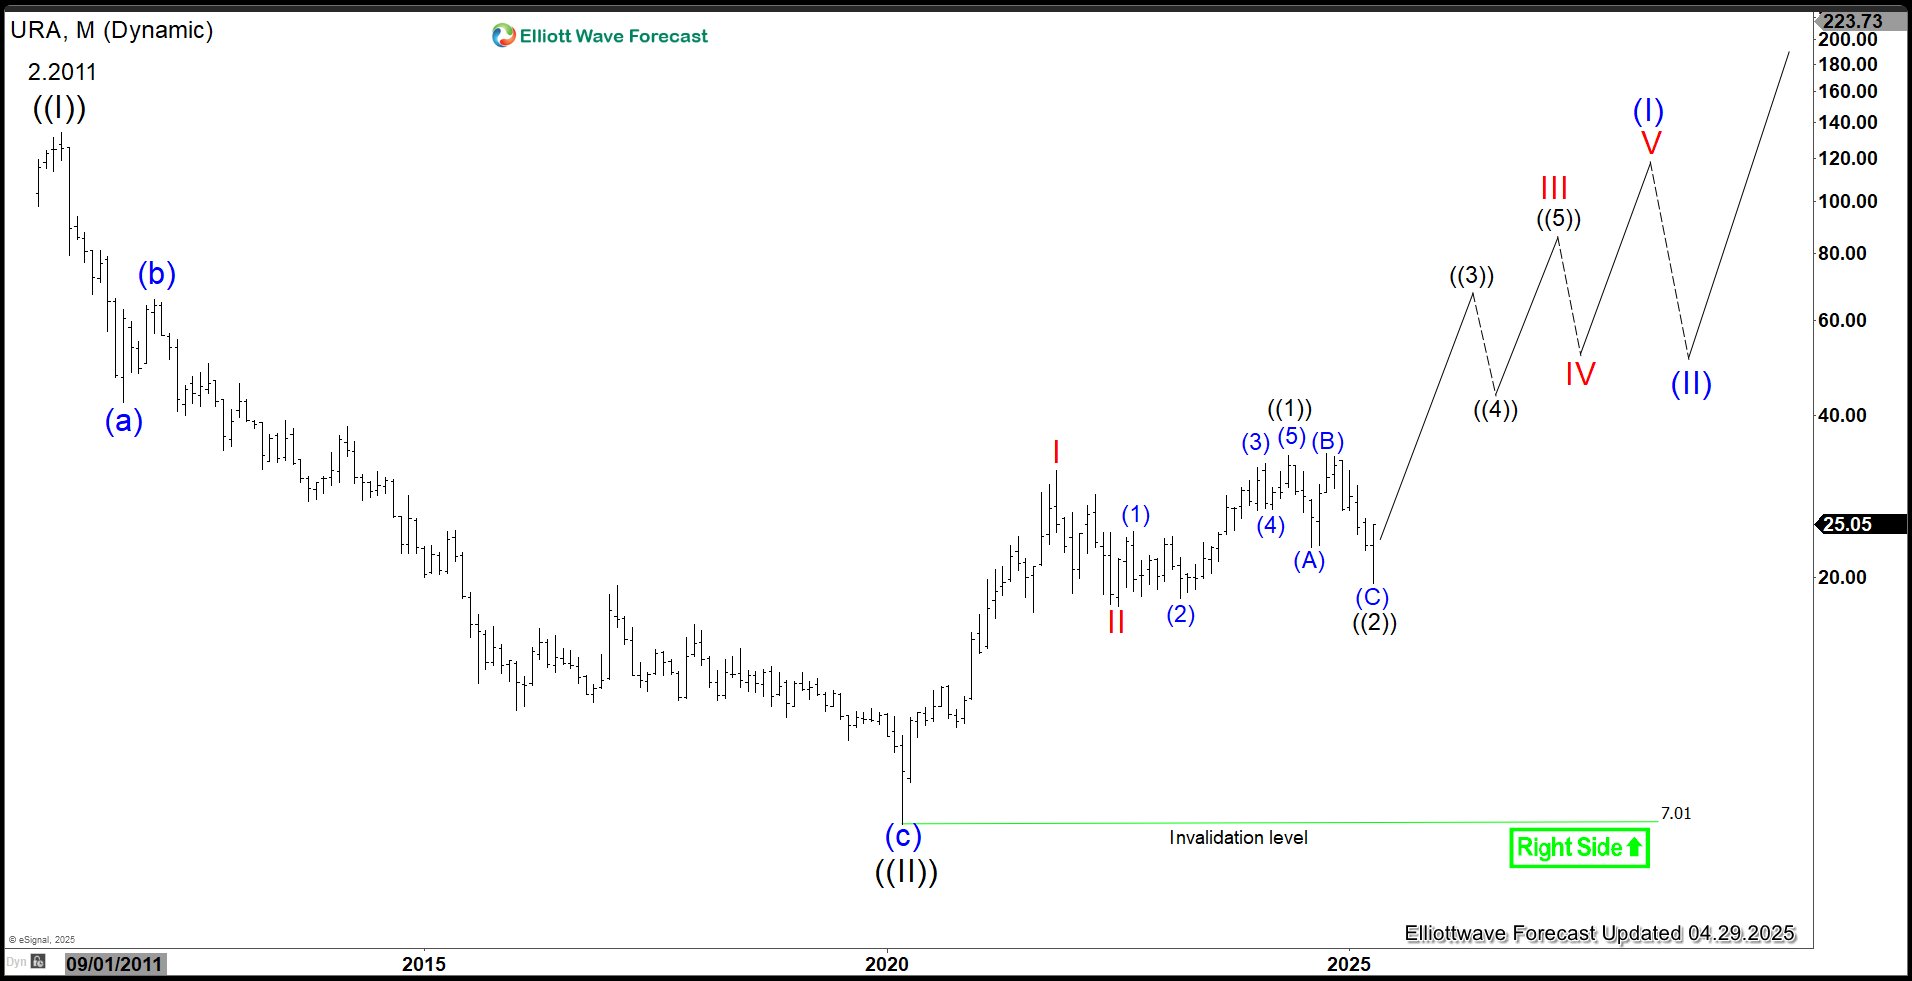
$URA Elliott Wave Chart Monthly Chart

The monthly chart of $URA indicates that the ETF completed wave ((II)) of the Grand Super Cycle at 7.01. Since then, it has been advancing in an impulsive structure. From the March 18, 2020 low, wave I peaked at 31.60, followed by a wave II pullback that concluded at 17.65. The ETF then progressed in wave III, which unfolds in five sub-waves. From the wave II low, wave ((1)) reached 33.66, and the wave ((2)) pullback ended at 19.50. As long as the 7.01 pivot remains intact, the ETF is expected to continue its upward trajectory.
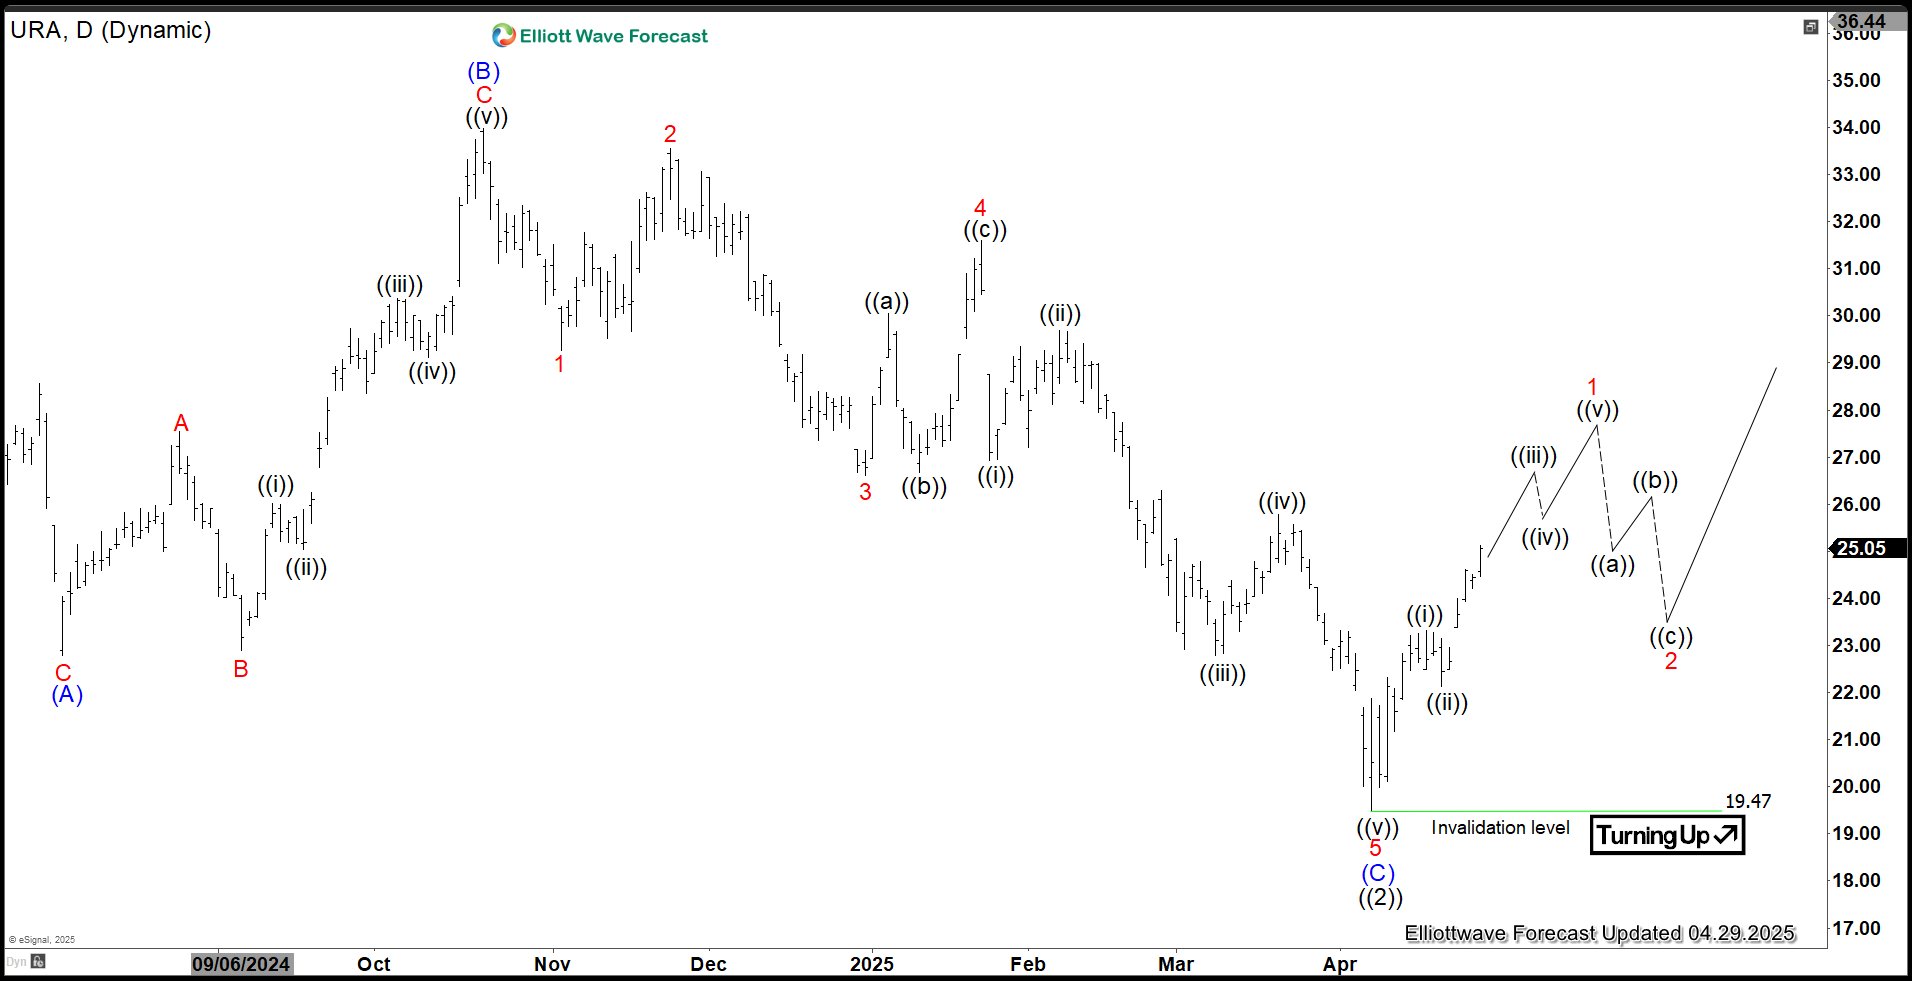
$URA Daily Elliott Wave Chart

The daily chart of $URA indicates that wave ((2)) concluded at 19.47, unfolding as an expanded flat. Within this structure, wave (A) bottomed at 22.79, wave (B) rallied to 33.99, and wave (C) declined to 19.47, completing wave ((2)). The ETF has since turned higher, and as long as the 19.47 pivot holds, any pullbacks are expected to find support in a 3, 7, or 11-swing structure, setting the stage for further upside.
Source: https://elliottwave-forecast.com/stock-market/uranium-miners-etf-ura-correction-likely-now-rising/
