Fibonacci sequence – 1, 1, 2, 3, 5, 8, 13, 21, 34, 55, 89, 144, etc.
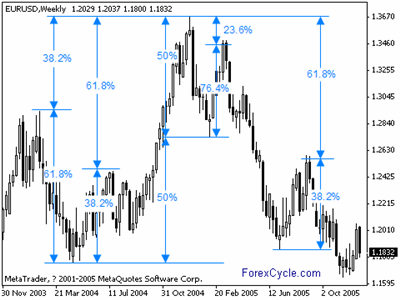
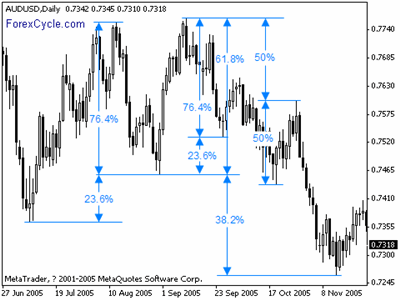
Interpretation of the Fibonacci numbers in forex technical analysis anticipates changes in trends as prices approach lines created by the Fibonacci studies. When used in technical analysis, the golden ratio is typically translated into three percentages: 38.2%, 50% and 61.8%. However, more multiples can be used when needed, such as 23.6%, 161.8%, 423% and so on.
golden ratio in EURUSD weekly chart

golden ratio in AUDUSD daily chart


