MACD Divergence or Moving Average Convergence/Divergence is a useful indicator for spotting major changes in market trend, indicate trend direction and for giving hints of a possible market reversal. It is one of the strongest signals generated by technical indicators such as crossovers and divergence from price on a daily chart.
This MACD method, developed by Gerald Appel also referred to as a trending indicator, indicates the up-trend or a downtrend of a particular stock. It is essential that you first assess the track of the long-term trend, before you invest in any market.
The MACD method as used by Gerald Appel makes applicable a 26-day and 12-day EMA based on the daily close, and a 9-day EMA for the signal line. If you are a bit confused, let me acquaint you with the simplest version of the MACD indicator. It is composed of two lines: the MACD line and a signal line.
While the MACD line is the difference between two exponential moving averages (EMAs), the signal line is the EMA of the MACD line itself. You can find the signal line plotted on top of the MACD, which indicates buy or sell opportunities in the market. The two main sets of signals generated by the MACD are crossovers and divergence.
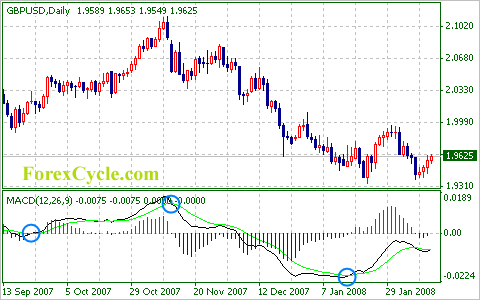
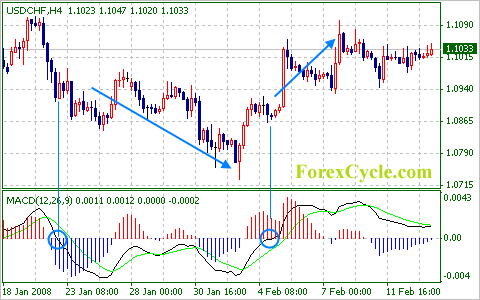
- Crossovers: One of the two MACD crossovers is Signal Line Crossovers, which refers to when MACD crosses above or below the signal line. When the MACD rises above the signal line, it is buying time, and when the MACD goes below the signal, it is selling time according to MACD trading rule. It is recommended that the Signal Line Crossovers be used in combination with other technical analysis tools to avoid many false signals.

- On the other hand, when MACD crosses above or below the zero line, it is called Zero Line Crossovers. When you need to buy/sell stocks when the MACD crosses above/below the zero line, this zero line helps in producing a signal.

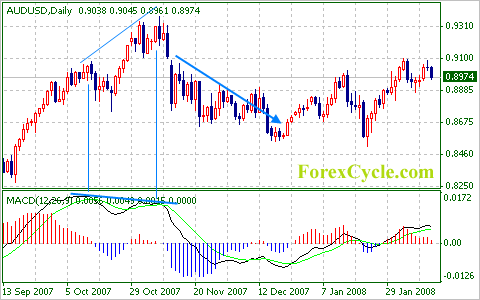
- Divergence: When the MACD makes a higher low but the market makes a lower low, then it is called positive divergence. On the other hand, when the MACD makes a lower high while the market makes a higher high, it is known as negative divergence. While the former situation gives us a hint of a possible reversal to the upside, the latter gives us a hint of a possible reversal to the downside.

However, market experts believe that the best way to use MACD would be an amalgamation of signals to verify one another. There are also recommendations of the addition of fast MACD lines to enhance the signals generated and to provide early warning of trend changes. It is also noteworthy that MACD can provide premonition of important market turns through divergence.
The MACD also has its own set of weaknesses. Just as being a trend indicator, MACD sometimes fails to capture the move when the trend is short lived, even though it reliable enough to capture the majority of the move, when a substantial trend develops.

