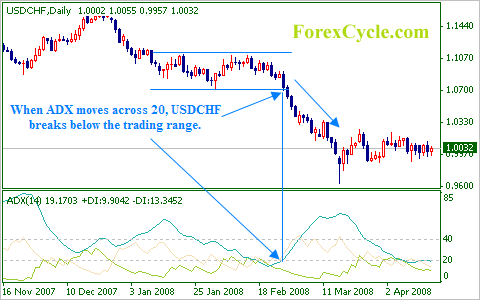
Developed by J. Welles Wilder Jr., Average Directional Index (ADX) is one of the most trusted ways to evaluate the strength of the current market trend, be it upwards or downwards. Measured in an oscillator that fluctuates between 0 and 100, readings above 60 are considered comparatively rare. While a weak trend is marked for low readings below 20, a strong trend is indicated with high readings above 40, it is important to determine whether the market is trending or trading (moving sideways).
When ADX begins to reinforce from below 20 and moves above 20, it indicates that the trading range is ending and a trend is emerging. Conversely, an ADX decline from above 40 might signal that the current trend is weakening and a trading range is developing. Although the indicator does not grade the trend as bullish, it however, evaluates the strength of the current trend.

After all, ADX is one of the most recommended endeavors to measure the strength of the direction the security is moving in, and to recognize impending changes in a market from trending to non-trending. You must always remember that ADX must always be 30 or more, or else no action is taken unless the ADX has achieved this reading. Also, it is important for an investor entering the market to have a firm stop on the primary entry, based on the most recent high or most recent, low depending on direction.
Average Directional Index is derived from two indicators prior developed by Wilder, known as Positive Directional Indicator (+DI) and the Negative Directional Indicator (-DI). While +DI measures the force of the upward movement and -DI measures the force of the downward movement over a given period, the default setting is 14 periods. However, users can amend these settings according to their individual penchant.
The ADX can merge +DI with -DI and then level the data with a moving average to offer a dimension of trend strength. However, since ADX uses both +DI and -DI, it shows only strength and no indication of any trend direction.
The importance and usability of ADX is that buy and sell signals act on crossings +DI/-DI. When -DI crosses +DI from top, a sale signal occurs and when +DI crosses -DI from below, buy signal occurs. At the same time, it is important for an investor to observe a trend at an early stage of development to gain the highest benefit from his deals.
One of the few limitations of ADX is that, the input signal submitted by crossing of +DI and -DI in many cases might be false if the currency pair remains in a trading range. An example of ADX calculation indicates that ADX is a DX, leveled by the exponential moving average for “the n periods”
ADX = MA (DX, n, E).
While DX is a distinction between + DI and -DI, it is calculated according to this fact and provides the value with directed movement. The sum of -DI and +DI gives the value of total amount of directed movement during this period.
