The purpose of moving averages is purely to determine the mean exchange rate or price of currency pair in a given period of time. The simple moving average (SMA) and the exponential moving average (EMA) are the most widely used types of moving averages. The former is done, for example, by registering the closing prices of the last 50 days, summing them and finally dividing the sum by 50. This gives us the simple moving average for a period of 50 days. Exponential moving averages are similar to simple moving averages, but they are more complicated to calculate. They give more importance to the latest closing prices and hence react more rapidly to recent changes. Luckily, EMAs are mechanically and immediately determined by the majority of charting packages.
On daily charts, the periods of time that are most widely employed in moving averages consist of ten, twenty, fifty and two hundred day periods. Just like in other calculations, we obtain a more dependable result when we use longer periods of time. Nevertheless, moving averages for more brief time periods are able to react faster to the changes in the market. Moreover, they also offer us indications to buy or sell sooner.
We should highlight that simple moving averages will change in accordance with the type of chart that we use, i.e. depending on whether we use a daily chart or an hourly chart. Using an hourly chart, in order to obtain a moving average line for a twenty-day period, we must employ a simple moving average of 480 hours, i.e. twenty days multiplied by twenty-four hours.

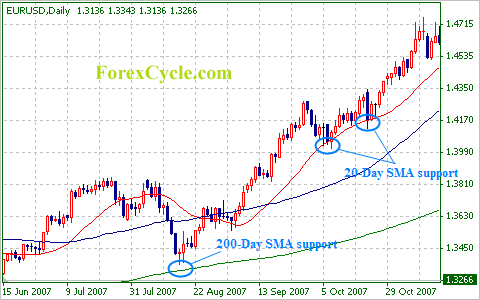
When using moving averages to buy and sell, you should enter at the time when a powerful trend drops to a curving line. You can also enter when the moving average crosses over.
The global trend is presented by moving averages as an evened-out line. The smoothness of the line depends on the length of the period, i.e. the line is smoother when longer periods are used. If you want to determine the force of a market trend, draw the simple moving averages for the ten, twenty, fifty and two hundred day periods. With an upwards moving trend, the averages calculated for shorter periods are supposed to be higher than the averages calculated for longer periods. Moreover, the actual price is supposed to be higher than the simple average for the ten-day period. The preference of the trader should be focused on the upper side and they should seek chances to buy in the instances in which the price drops and not adopt a short position.
Like in all other cases, buyers and sellers should verify candlestick patterns, as well as further indicators, to check the true market conditions at a given moment. The Bullish Engulfing Pattern is represented on the above figure. It appears right at the time when the currency pair rebound from the exponential moving average for the twenty-day period. There may be a bullish trend when the exponential moving average for the twenty-day period is hit together with the candlestick pattern.
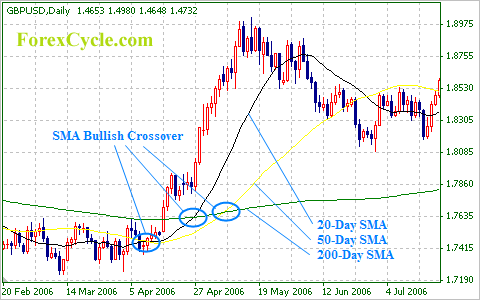
When a moving average for a shorter period of time moves over to a moving average for a longer period of time; for example, when the exponential moving average for the twenty-day period drops under the exponential moving average for the two hundred-day period, it may mean that the currency pair will head towards the moving average for the shorter period. In the example that we have given, this would mean that the moving average would drop. In the same way, if it moves back higher than the exponential moving average for the longer period, this may suggest a trend alteration. Hence, in the example that we have given, it would move upwards. Since moving averages provide us with a mean price for a certain time frame, crossovers normally “lag behind” the latest developments in the market. This means that moving averages depict previous market movements. An upwards trend occurs when a moving average for a short time period moves up and higher than the moving average for a longer time period. On the other hand, we know that a downwards trend might soon appear if the moving average for the short time period moves down and under the moving average for the longer time frame. More dependable outcomes are obtained from crossovers of moving averages in trending markets which reach new lows or new highs. With markets that are range bound, it is possible that moving averages will cross over each other often. Consequently, we may be getting unreliable trading signals. Hence, it is essential to determine what kind of market we are dealing with, i.e. whether it is a range bound or a trending market.
The chart below shows moving averages used on the GBP/USD. Pay attention to the fact that the three outside up pattern cuts through the moving average for the twenty-day period, depicted in black, simultaneously with the simple moving average for the fifty-day period, shown here in yellow, moving over the simple moving average for the two hundred-day period, which is here shown in green. This is a reversal pattern. Together with the fact that the price has rebounded from the moving average for the two hundred-day period, it tells us that impetus of the downwards movement is over. Hence, this is a signal that a recovery is possible to ensue next.


