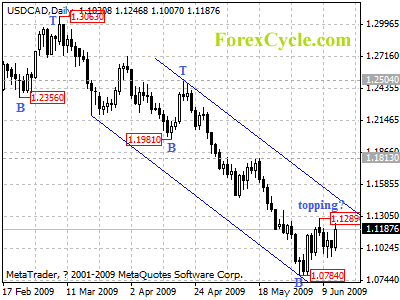
USDCAD is forming a cycle top at 1.1289 level on daily chart. As long as 1.1289 resistance holds, we’d expect the downtrend to resume and further fall towards 1.0400 zone is possible. However, above 1.1289 level will indicate that lengthier consolidation of downtrend from 1.3063 is underway, then further rally could be seen to test the resistance of the upper border of the price channel on daily chart.
For long term analysis, USDCAD has formed a cycle top at 1.3063 level on weekly and monthly chart. The pair is now in long term bearish movement. Further fall towards 1.0000 is expected in next several weeks.


