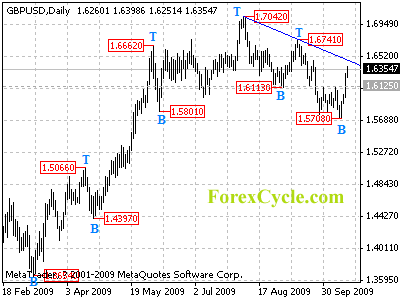
GBPUSD broke above 1.6125 key resistance and reached as high as 1.6399 level, suggesting that a cycle bottom has been formed at 1.5708 level on daily chart. Further rise to test the resistance of the falling trend line from 1.7042 to 1.6741 is expected next week, a clear break above the trend line resistance will take price to test 1.6741 resistance. However, as long as 1.6741 resistance holds, the rebound is treated as correction of downward trend from 1.7042 and another fall below 1.5708 is still possible after correction.
For long term analysis, GBPUSD has formed a cycle top at 1.7042 level on weekly chart. Further fall to 1.5000 area to reach next cycle bottom is expected in next several weeks.

