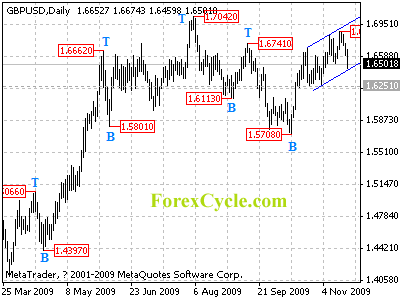
GBPUSD dropped from 1.6875 and is testing the support of the rising price channel on daily chart, if give way, deeper decline could be seen to test 1.6251 key support, a breakdown below this level will indicate that a cycle top has been formed at 1.6875 level on daily chart, then the following pullback could take price towards 1.5708 previous low. However, as long as 1.6251 support holds, the pair remains in uptrend from 1.5708 and another rise towards 1.7042 previous high is still possible.
For long term analysis, GBPUSD might be forming a cycle bottom at 1.5708 level on weekly chart, key resistance is at 1.7042, a break above this level will confirm the cycle bottom.


