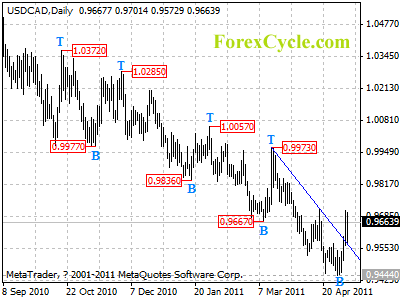
USDCAD broke above the downtrend line on daily chart, suggesting that a cycle bottom had been formed at 0.9444 on daily chart. Further rally is expected in a couple of weeks, and next target would be at 0.9800-0.9900 area.
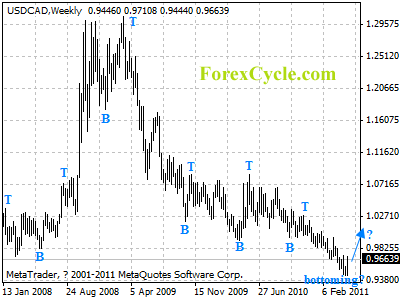
For long term analysis, USDCAD might be forming a cycle bottom at 0.9444 on weekly chart. Key resistance is at 0.9800, a break above this level will confirm the cycle bottom.