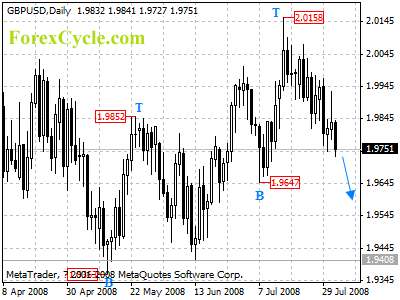
GBPUSD formed a cycle top at 2.0158 on daily chart and is now in down trend. Deeper decline to test 1.9337 (Jan 22 low) is still possible, and a break below 1.9647 will confirm such case. Key resistance is at 2.0158, only rise above this level will signal further rally towards 2.0391 (Mar 14 high).
For long term analysis, GBPUSD might be forming a cycle top at 2.0158 on weekly chart. Key support is located at 1.9647, a break down below this level will confirm the cycle top.


