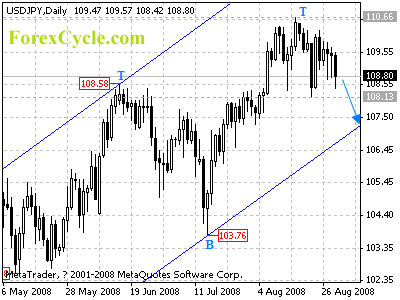
USDJPY traded in range between 108.13 and 110.66. Pullback towards the lower boundary of the price channel to reach next cycle bottom on daily chart is now in favor. On the other side, a break above 110.66 will signal resumption of up trend, and further rally towards 113.00-50 area could be seen.
For long term analysis, USDJPY formed a long term cycle bottom at 95.77 (Mar 17 low) on monthly chart and is now in long term up trend. Further rise towards 120.00 is in favor.


