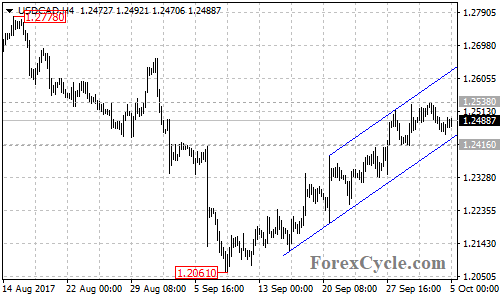
USDCAD moved sideways in a trading range between 1.2416 and 1.2538. As long as the price is in the bullish price channel on the 4-hour chart, the sideways movement could be treated as consolidation of the uptrend from 1.2061 and further rise towards 1.2700 could be expected after the consolidation. Resistance is at 1.2538, above this level could signal resumption of the uptrend.
Key support is at 1.2416, a breakdown below this level would indicate that the upside movement from 1.2061 had completed at 1.2538 already, then the following bearish move could take price back towards 1.2061 previous low.


