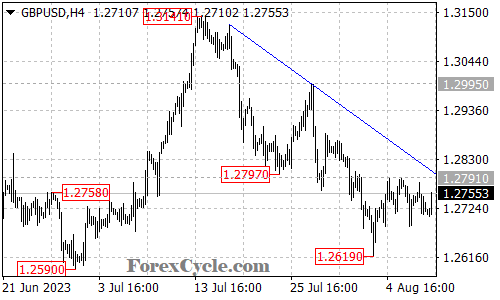
GBPUSD has continued its sideways movement within a trading range between 1.2619 and 1.2791.
As long as the price remains below the falling trend line on the 4-hour chart, the sideways movement can be considered as consolidation within the overall downtrend from 1.3141. In this scenario, another potential fall to test the 1.2590 support level is still possible after the consolidation. A breakdown below this level could potentially trigger a further downside move toward the 1.2500 area.
The immediate resistance level to monitor is now at 1.2791. A break above this level could provide a signal of potential completion of the downtrend.
Traders should closely observe the price action and the behavior around the falling trend line, support, and resistance levels mentioned for potential breakout or reversal signals.
To summarize, the analysis suggests that GBPUSD continues to trade sideways within the downtrend. A breakdown below 1.2590 could lead to further downside towards 1.2500, while a break above the resistance at 1.2791 could imply a potential reversal. Traders should remain attentive and adapt their strategies accordingly.