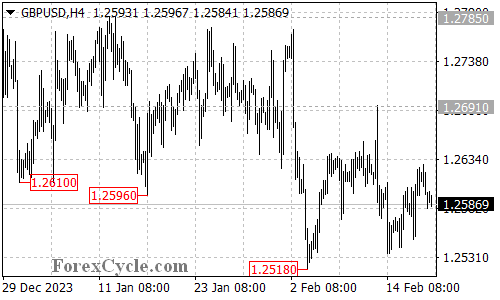
GBPUSD has been stuck in a sideways dance between 1.2518 and 1.2691, leaving traders wondering whether this signifies a pause in the downtrend or simply consolidation before further decline. Let’s analyze the technicals to understand the key levels and potential scenarios.

Sideways Shuffle: Consolidation or Downtrend Pause?
- Trading Range: GBPUSD currently finds itself confined within a defined trading range of 1.2518 and 1.2691. This lack of clear direction could be interpreted as either consolidation within the prevailing downtrend from 1.2827 or a brief pause before further decline.
Support Levels to Watch for Downside Moves
- 1.2550 Initial Hurdle: If the sellers regain control and push the price below 1.2550, it could signal a resumption of the downtrend. This could lead to a retest of the 1.2518 support level.
- 1.2400: Deeper Decline or Bounce?: A further breach of 1.2518 could trigger a more significant decline towards the 1.2400 area, further reinforcing the downtrend.
Resistance Levels for a Potential Upturn
- 1.2640: First Step Up: If the bulls step in and break above 1.2640, it could indicate a potential bounce within the range.
- 1.2691: Range Ceiling or Breakout?: Reclaiming the 1.2691 resistance would be a more significant development, possibly suggesting a breakout from the range and aiming for higher levels.
Overall Sentiment
The technical picture offers conflicting signals for GBPUSD. The sideways movement leaves the near-term direction uncertain. While the downtrend remains the dominant force, a breakout above 1.2691 could signal a bullish shift. Monitoring the price action around the mentioned support and resistance levels will be crucial in determining the pair’s next move.

