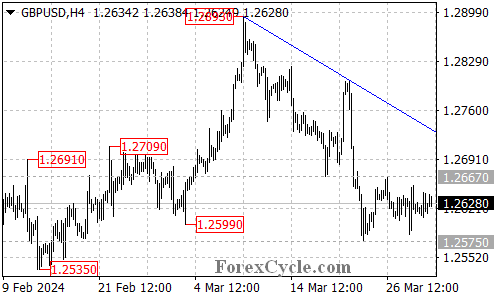
GBPUSD has entered a period of indecision, trading within a defined range for several days. This analysis examines the technical situation and explores potential scenarios for the currency pair.

Sideways Stalemate:
- Rangebound Trading: GBPUSD has been stuck in a trading range between 1.2575 and 1.2667 for several days. This sideways movement suggests a temporary pause in the downtrend that began at 1.2893.
Downtrend or Consolidation?
- Resistance Holding Firm: As long as the resistance level at 1.2667 holds, the rangebound trading could be considered a consolidation phase within the broader downtrend.
- Downtrend Resumption: If the resistance holds and the price breaks below support at 1.2575, it could signal a resumption of the downtrend. The next potential target zones to watch in this scenario would be around 1.2555 and even lower at 1.2400.
Looking for Signs of a Reversal:
- 1.2667 Resistance in Focus: A breakout above the current resistance level at 1.2667 would be a bullish sign. This move could indicate a potential upward correction or even a trend reversal.
- Falling Trend Line Resistance: A more significant bullish signal would be a breakout above the falling trend line resistance on the 4-hour chart.
- Downtrend Completion: Overcoming this key technical hurdle would suggest a possible completion of the downtrend that began at 1.2893.
- Upside Potential: A successful breakout above these resistance levels could trigger a further rise, potentially reaching the previous high at 1.2893.
Overall Sentiment:
The technical outlook for GBPUSD is currently uncertain. The sideways rangebound trading creates indecision. A breakout above 1.2667 or a breakdown below 1.2575 will be crucial in determining the future direction of GBPUSD. A break above resistance suggests a potential trend reversal, while a break below support indicates a continuation of the downtrend. Close monitoring of price action around these key levels will be essential.
