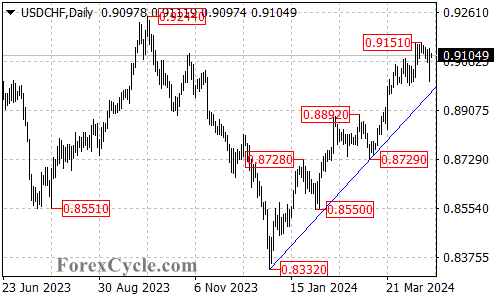
USDCHF’s recent price action presents an interesting technical situation. This analysis examines the trend and explores potential scenarios for the currency pair.

USDCHF Above Rising Trend Line:
- Uptrend Still Intact: A key technical indicator for USDCHF is the rising trend line on the daily chart. As long as the price remains above this trend line support, the uptrend that began at the December 2023 low of 0.8332 is likely still in play.
- Pullback as Consolidation: The recent decline from the high of 0.9151 could be interpreted as a consolidation phase within the broader uptrend.
Upside Potential After Consolidation?
- Further Rise Expected: After the consolidation phase, further upside can be expected.
- Resistance Levels to Watch: A breakout above the resistance level at 0.9151 would be a bullish signal. This breakout could trigger another rise towards the next potential target zones at 0.9240 and 0.9350.
Downtrend Scenario:
- Trend Line Break as Bearish Signal: A crucial factor to watch is the rising trend line support. A decisive break below this trend line would be a significant development. This move could indicate that the upside move from 0.8332 has already completed at 0.9151.
- Downside Targets: In a downtrend scenario, the next potential target zones could be 0.8850 and 0.8750.
Overall Sentiment:
The technical outlook for USDCHF is bullish, as long as the price stays above the rising trend line. The recent pullback could be a consolidation phase within the uptrend. However, a break below the trend line would suggest a potential trend reversal. Close monitoring of price action around the key support and resistance levels is essential.

