
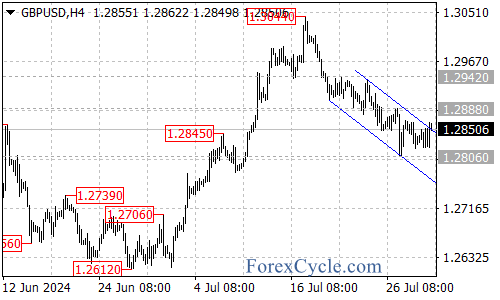
The British Pound/US Dollar (GBP/USD) pair has recently broken above the top of its falling price channel on the 4-hour chart, signaling a potential shift in momentum. Let’s break down the key levels and scenarios to watch:
Bullish scenario:
- The pair is likely to test the 1.2888 resistance level in the coming days.
- A breakout above 1.2888 would suggest that the downward move from 1.3044 has completed at 1.2806.
- If this occurs, the next target could be the 1.2940 area.
Bearish scenario:
- As long as the 1.2888 resistance holds, price action between 1.2806 and 1.2888 may be seen as consolidation within the larger downtrend from 1.3044.
- A breakdown below the 1.2806 support could trigger further downside movement towards 1.2780.
- If 1.2780 fails to hold, the next target would be the 1.2710 area.
Key levels to watch:
- Resistance: 1.2888
- Support: 1.2806, 1.2780, 1.2710
Remember, always use proper risk management techniques and consider multiple timeframes when making trading decisions.