
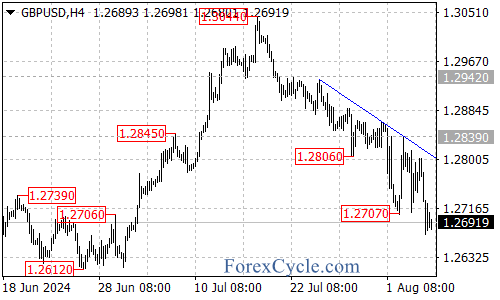
The GBP/USD pair has extended its downward move from 1.3044 to a recent low of 1.2672. Let’s break down the key levels and potential scenarios for traders to watch in the coming days.
Current Trend
- The pair remains in a downtrend as long as the price stays below the falling trend line on the 4-hour chart.
- The recent bounce from 1.2672 is likely a consolidation within this downtrend.
Key Levels to Watch
- Support Levels:
- Immediate support: 1.2672
- Next target: 1.2640 area
- Resistance Levels:
- Initial resistance: 1.2750
- Key resistance: Falling trend line on the 4-hour chart
Potential Scenarios
- Bearish Scenario:
- If the price remains below the falling trend line, we can expect the downtrend to continue.
- A breakdown below 1.2672 could trigger further declines towards the 1.2640 area.
- Bullish Scenario:
- A break above the initial resistance at 1.2750 could bring the price back towards the falling trend line.
- Only a break above the trend line resistance would signal the completion of the downtrend, with the next targets at 1.2839 and potentially the 1.2900 area.
Conclusion
The GBP/USD pair is currently in a strong downtrend, but traders should keep an eye on the key support and resistance levels for potential trading opportunities. A break below 1.2672 could lead to further declines, while a break above the falling trend line could signal a trend reversal.
Remember to always use proper risk management techniques and consider multiple timeframes when making trading decisions based on this analysis.