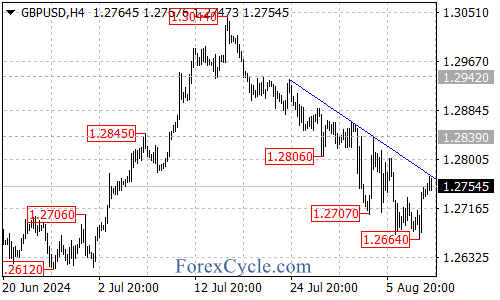
The GBP/USD pair is currently facing a crucial resistance level at the falling trend line on the 4-hour chart. This resistance could determine the pair’s short-term direction and potentially signal a bullish reversal.
Key Levels to Watch
- Resistance:
- Falling trend line on the 4-hour chart
- Break above the trend line could trigger further upside
- Next resistance: 1.2839
- Support:
- Initial support: 1.2710
- Break below 1.2710 could lead to a test of 1.2664
- Further support: 1.2600 area
Potential Scenarios
- Bullish Scenario:
- If GBP/USD breaks above the falling trend line, it could suggest that the downside move from 1.3044 has completed at 1.2664.
- This breakout could open the door for a rally towards the next resistance at 1.2839.
- Bearish Scenario:
- A breakdown below 1.2710 would be a bearish signal, potentially triggering another decline to test the 1.2664 support.
- A break below 1.2664 could extend losses towards the 1.2600 area.
Conclusion
The GBP/USD pair is at a critical juncture, with the falling trend line acting as a key resistance level. A breakout above this trend line could signal a bullish reversal and a potential move towards 1.2839. However, if the pair fails to break above the trend line and instead breaks below 1.2710, it could lead to further declines. Traders should closely monitor these levels and be prepared for increased volatility in the coming sessions.
Remember to always use proper risk management techniques and consider multiple timeframes when making trading decisions based on this analysis.