
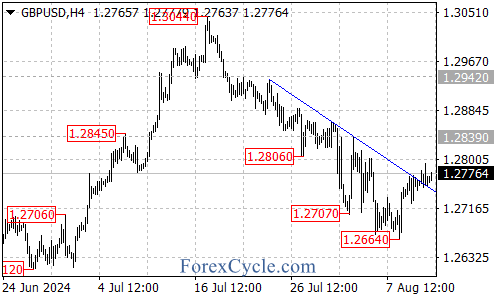
The GBP/USD pair has recently broken above the falling trend line on the 4-hour chart, indicating that the downward movement from 1.3044 may have completed at 1.2664. This development suggests a potential rally in the coming days.
Key Levels to Watch
- Resistance Levels:
- The next target for the pair is the resistance level at 1.2839.
- If the price breaks above 1.2839, it could aim for the next resistance at 1.2942.
- Support Levels:
- Initial support is at 1.2740 and 1.2725.
- A breakdown below these levels could lead to a test of the previous low support at 1.2664.
- If this level is breached, the pair may target the 1.2600 area.
Potential Scenarios
- Bullish Scenario: If GBP/USD continues to hold above the falling trend line and breaks through the resistance at 1.2839, it could indicate a shift towards a bullish trend, with further gains likely towards 1.2942.
- Bearish Scenario: Conversely, if the pair falls below the support levels at 1.2740 and 1.2725, it may signal a return to the previous lows at 1.2664 and potentially lower towards 1.2600.
Conclusion
The recent breakout above the falling trend line is a positive sign for GBP/USD, suggesting that the downtrend may be over. Traders should closely monitor the key resistance and support levels to identify potential trading opportunities. A sustained move above 1.2839 could lead to further gains, while a drop below 1.2740 could signal renewed bearish pressure.
As always, ensure proper risk management when trading in the current market environment.